You're collecting feedback from your users, great. But how do you actually measure whether they're happy, loyal, or frustrated? That's where the debate of NPS vs CSAT vs CES comes in. These three metrics each measure a different dimension of the customer experience, and picking the wrong one (or using them incorrectly) can send your product decisions in the wrong direction entirely.
Net Promoter Score tracks loyalty. Customer Satisfaction Score measures happiness with a specific interaction. Customer Effort Score tells you how easy or hard something was. They sound straightforward on paper, but the differences matter, especially when you're deciding what to build next based on what your users are telling you.
At Koala Feedback, we help product teams collect, organize, and prioritize user feedback so they can build what actually matters. Understanding which CX metric fits your goals is a critical piece of that puzzle. This article breaks down all three metrics side by side, what they measure, when to use each one, and how to decide which combination works best for your product and team in 2026.
Customer expectations haven't gotten simpler over time. In 2026, users have more options than ever, switching costs are low, and word-of-mouth travels fast. CX metrics give you a structured, repeatable way to understand how your users actually feel, instead of relying on gut feelings or anecdotal Slack messages from your support team. Without a number tied to the experience, it's hard to know whether things are improving, declining, or staying flat while your competitors pull ahead.
Not every satisfied customer is a loyal one. This is one of the most important distinctions in the nps vs csat vs ces debate, and it's a reason why so many teams end up measuring the wrong thing. A user can rate an interaction a 5 out of 5 and still cancel their subscription three weeks later because the product never solved their core problem.
Satisfaction at a single touchpoint and loyalty over time are two different things, and conflating them is one of the most common measurement mistakes product teams make.
Retention is driven by the overall experience, not just one good support call or a smooth onboarding flow. The software market has matured. Users aren't impressed by a polished UI alone anymore. They expect the whole journey to feel seamless, and they'll tell you exactly where it breaks if you give them the right question to answer.
Many product teams build based on what they think their users want. They rely on feature requests from the loudest customers, internal assumptions, or what competitors are shipping. This approach carries a real cost: you end up building the wrong things, and you only find out after spending weeks in development.
Measuring CX at key moments in the user journey changes how you prioritize. When you know your support experience scores low on effort, you fix documentation or reduce friction in the help flow before you add a new feature. When your loyalty score drops after a product update, you investigate what changed instead of assuming it was something external. These are concrete decisions that come directly from having a score attached to the experience.
Quantifying user sentiment also makes internal conversations easier. Instead of debating whether a problem is serious, you can point to a trend line. Leadership, product, and engineering can align around what the data shows, which shortens the cycle from "users are frustrated" to "here's what we're fixing." In 2026, that speed matters because the teams shipping fastest based on real signals are the ones gaining ground.
Net Promoter Score (NPS) measures how likely your users are to recommend your product to someone else. It was introduced by Fred Reichheld in a 2003 Harvard Business Review article and has since become one of the most widely used loyalty metrics in the software industry. NPS doesn't measure a single interaction. It captures the overall relationship a user has with your product over time, which is what sets it apart in the nps vs csat vs ces conversation.
You ask users one question: "On a scale of 0 to 10, how likely are you to recommend [your product] to a friend or colleague?" Based on their answer, you sort respondents into three groups. Users who answer 9 or 10 are Promoters, those who answer 7 or 8 are Passives, and anyone who scores 0 through 6 is a Detractor. Passives don't factor into the final score at all.
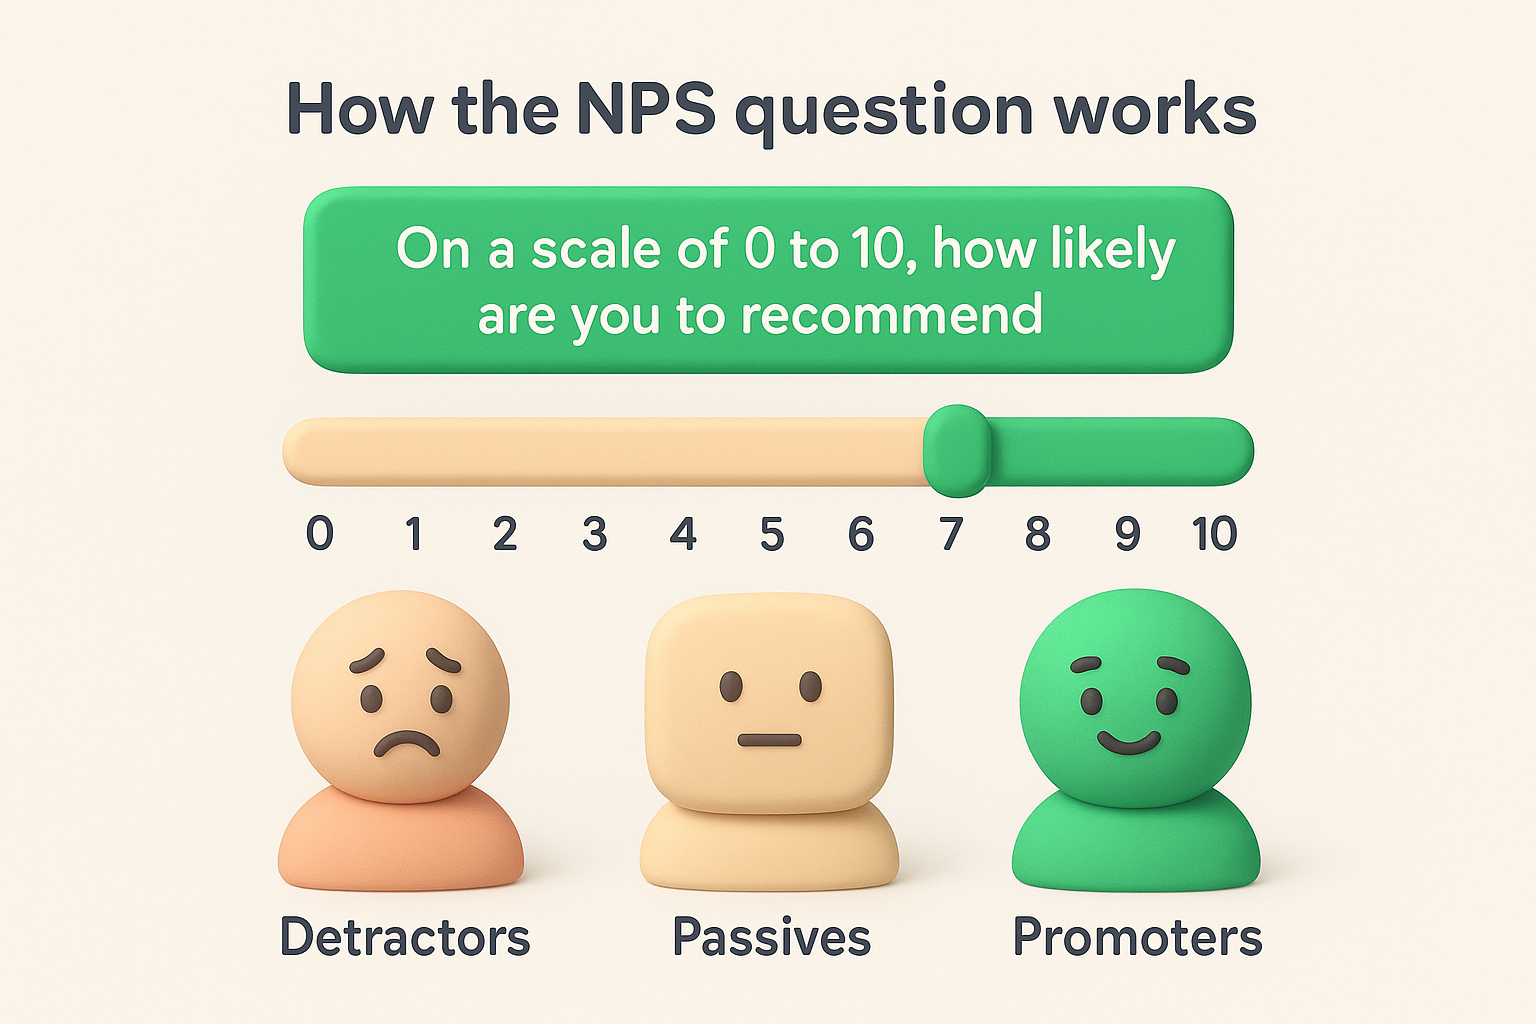
The formula itself is simple:
NPS = % of Promoters - % of Detractors
If 60% of respondents are Promoters and 15% are Detractors, your NPS is 45. Scores range from -100 to +100, and anything above 0 means your loyal users outnumber your unhappy ones. A score above 50 is widely considered strong performance for most software products.
A high NPS doesn't automatically mean users are satisfied with every feature or touchpoint. It means they trust your product enough to put their reputation behind a recommendation.
Benchmarks vary significantly by industry, so comparing your NPS to companies in unrelated sectors won't give you useful data. What matters more than any single number is the direction your score moves over time. If your NPS drops after a product update or a pricing change, that's a signal worth investigating before it shows up in your churn numbers.
NPS becomes far more useful when you pair the numeric rating with a follow-up open-ended question asking users to explain their score. Without that qualitative context, you know someone is a Detractor but not what caused the frustration. Adding that second question turns NPS from a number on a dashboard into a source of feedback your product team can actually prioritize and act on.
Customer Satisfaction Score (CSAT) measures how satisfied a user feels immediately after a specific interaction with your product or support team. Unlike NPS, which captures long-term loyalty, CSAT is a transactional metric designed to evaluate a single moment in the user journey. It's one of the oldest customer experience measurements in use, and when you apply it to the right touchpoints, it gives you fast, targeted feedback on what's working and what needs fixing.
You ask users a direct question after a specific event, something like: "How satisfied were you with your experience today?" Respondents answer on a scale that typically runs from 1 to 5, where 1 is very dissatisfied and 5 is very satisfied. Some versions use a 1-to-10 scale or simple labels like "satisfied" and "unsatisfied," but the 1-to-5 format is the most common in software products.
The formula focuses on the positive end of the scale:
CSAT = (Number of satisfied responses / Total responses) x 100
If 80 out of 100 users rate their experience a 4 or 5, your CSAT score is 80%. Most teams count only responses of 4 or 5 as "satisfied," which means anything in the middle or below counts against you, even if a user didn't feel strongly negative. This makes CSAT a strict measure by design.
CSAT shines when you need quick, specific feedback on a customer support ticket, an onboarding session, or a new feature release. Because you send it immediately after the interaction, users respond while their memory of the experience is fresh, which makes the data more accurate than asking them to reflect on something that happened weeks ago.
CSAT tells you exactly how a user felt at one moment in time, but it says nothing about whether they'll stick around next month.
That limitation is why teams who rely solely on CSAT often miss early churn signals. In the nps vs csat vs ces comparison, CSAT fills a very specific role: it identifies friction at individual touchpoints. Pair it with a follow-up question asking users what could have been better, and you turn a simple score into a specific action item your team can address in the next sprint.
Customer Effort Score (CES) measures how much effort a user has to put in to complete a task, get a question answered, or resolve a problem with your product. Gartner researchers introduced it in 2010 after discovering that reducing effort, not just delighting customers, was the strongest predictor of loyalty and repeat usage. In the full nps vs csat vs ces picture, CES fills a gap the other two metrics don't cover: it tells you whether your product is actually easy to use when it counts.
You ask users a single question immediately after a key interaction, typically: "How easy was it to resolve your issue today?" or "How easy was it to complete [specific task]?" Respondents answer on a scale from 1 to 7, where 1 means very difficult and 7 means very easy. Some teams use a 5-point scale or a simpler agree/disagree format, but the 7-point version captures more nuance and is the most widely used in software products.
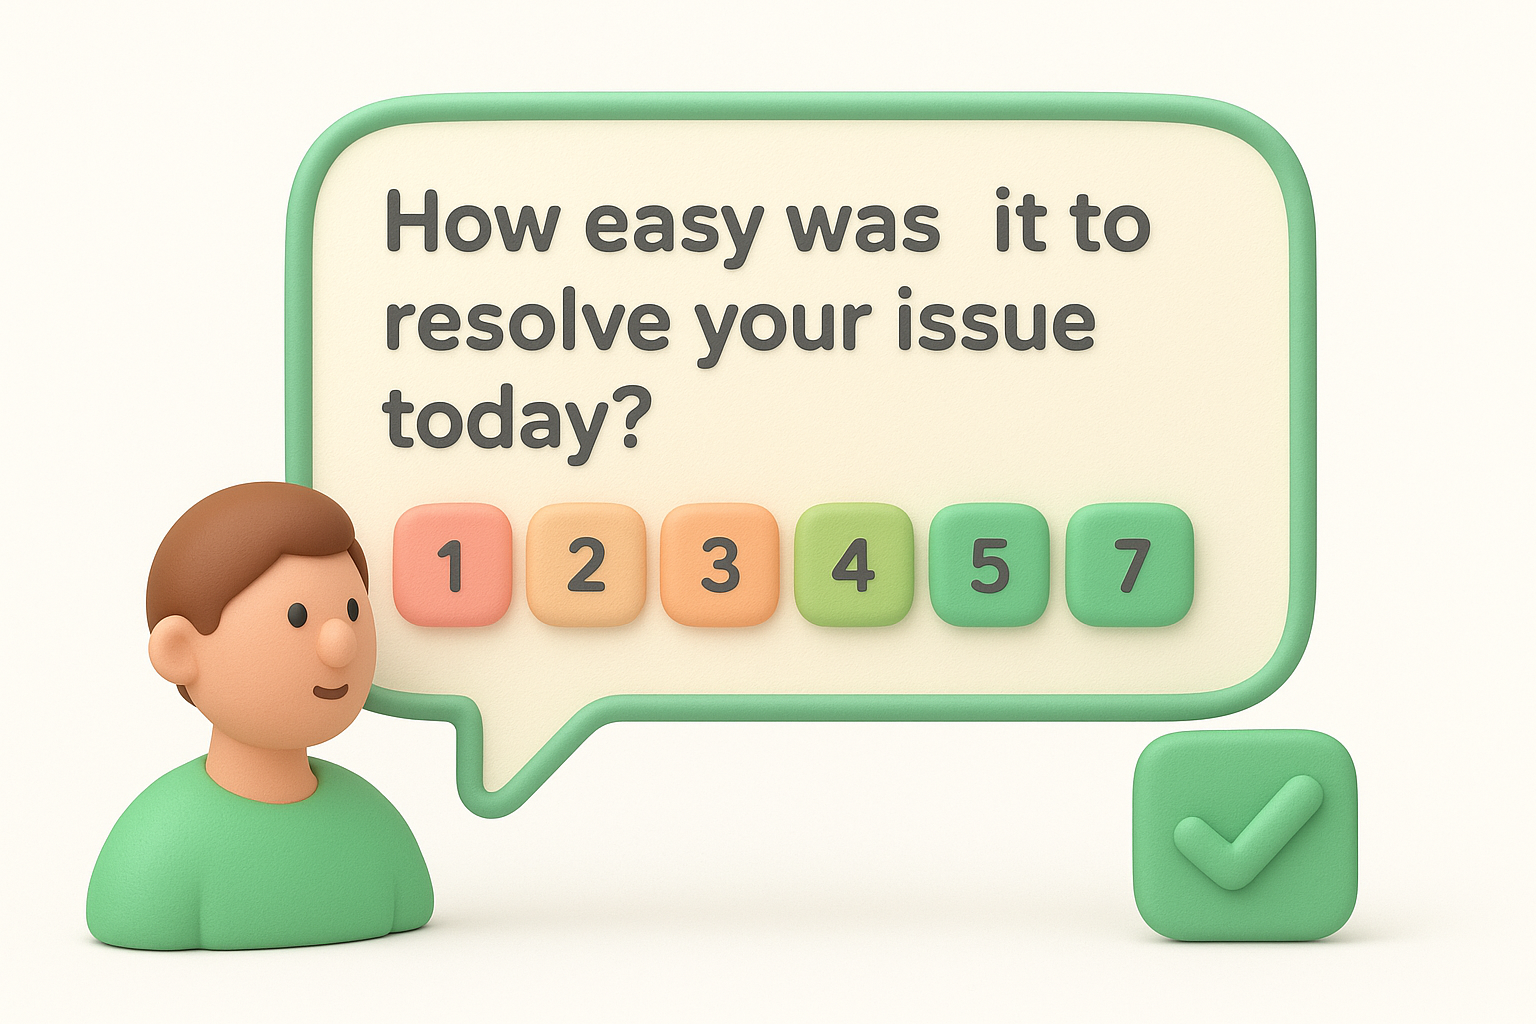
The formula is a straightforward average:
CES = Sum of all scores / Total number of responses
A higher score means users found the experience easier. Most teams aim for a score above 5.5 on a 7-point scale, though what counts as a good score depends on the specific task you're measuring. Onboarding flows, self-service help centers, and checkout processes are the most common places where CES produces actionable data quickly.
CES is purpose-built for identifying friction in specific workflows, which is something NPS and CSAT are not designed to surface with the same precision. When a user struggles to complete a task, that struggle creates frustration that compounds over time. A user who rates your onboarding effort a 2 out of 7 is not likely to stick around long enough to become a Promoter on your next NPS survey.
Effort is one of the strongest predictors of churn because difficulty sticks in users' memory longer than a moment of delight does.
Pairing a low CES score with a qualitative follow-up question gives your product team a specific area to fix, whether that's simplifying a multi-step form, improving search within your help docs, or reducing the number of clicks it takes to complete a core action. Without that context, the score tells you something is broken but not where to start.
Putting NPS vs CSAT vs CES next to each other makes the distinctions far clearer than reading about each one in isolation. Each metric serves a different purpose, operates at a different point in the user journey, and asks users to reflect on a different dimension of their experience. Knowing where each one applies prevents you from reaching for the wrong tool when you need a specific answer, and it prevents you from interpreting a score in a way that doesn't match what the metric was built to measure.
The fastest way to see what separates these three metrics is to compare them directly. What each survey measures and when you send it determines whether it fits your current question. The scale each metric uses also affects how you interpret scores and communicate results to your team.
| Metric | What it measures | Timing | Scale | Primary use case |
|---|---|---|---|---|
| NPS | Long-term loyalty | Periodically (quarterly or after milestones) | 0-10 | Predict retention and referrals |
| CSAT | Satisfaction at a touchpoint | Immediately after an interaction | 1-5 | Evaluate support, features, or onboarding |
| CES | Effort to complete a task | Immediately after a specific task | 1-7 | Identify friction in workflows |
No single metric tells the full story, so the question is never which one is best in absolute terms but which one answers the specific question you're asking right now.
NPS belongs at the relationship level, not the transaction level. You send it periodically, after a user has had enough time to form a real opinion of your product. Sending it three days after signup won't produce reliable data. For longer-term product strategy decisions and retention forecasting, NPS gives you the broadest view of how your user base feels about what you've built overall.

CSAT and CES both belong closer to specific moments in the experience. CSAT answers "did this interaction go well?" while CES answers "was this task easy enough to complete?" The two work well together. A user might rate a support ticket highly on satisfaction but still find the overall process effortful if they had to reach out multiple times to solve one problem. Running both at the right touchpoints gives you a more complete picture of where frustration builds before it shows up as churn.
Choosing between NPS, CSAT, and CES isn't about which metric is most popular or most talked about. It's about which question you actually need answered right now. The nps vs csat vs ces decision comes down to three factors: where the user is in their journey, what decision you're trying to make, and how quickly you need data you can act on. Start from the question, not the metric.
NPS is the right tool when you need to measure the overall relationship your users have with your product over time, not just how they felt after a single interaction. If you're preparing for a business review, tracking retention risk across a user cohort, or trying to understand whether a major product update shifted how your users feel about you broadly, NPS gives you that high-level signal. You send it periodically, not after every session or action.
Use NPS when you need a number that represents the health of the entire user relationship, not a specific moment within it.
A secondary signal worth watching: when your Detractors leave qualitative comments pointing to the same pain point repeatedly, that feedback feeds directly into your product roadmap. Consistent themes in open-ended NPS responses are often more actionable than the score itself because they tell you what to fix, not just that something is wrong.
CSAT works best when you need fast, targeted feedback on a specific interaction, like a support ticket resolution, a new feature walkthrough, or a completed onboarding step. If a user just finished something defined and you want to know whether it went well, CSAT gives you that answer quickly with minimal survey fatigue on their end.
CES is the better choice when you suspect friction is the core problem, not general dissatisfaction. If users are churning without raising support tickets or leaving negative reviews, effort may be quietly driving them out. Send CES surveys after your most complex workflows and look for low scores that correlate with drop-off points in your product analytics.
When you're unsure which to use, ask yourself what decision you're trying to make with the data. Retention and loyalty questions need NPS. Touchpoint quality questions need CSAT. Friction and usability questions need CES. Matching the metric to the decision keeps your data clean and your actions specific.
CX scores are only useful if they connect to action. A number sitting in a dashboard doesn't help your users or your product team. The real value of tracking NPS vs CSAT vs CES comes from building a workflow that moves low scores and qualitative comments into your prioritization process, where they can actually influence what gets built next.
Every time a user leaves a low score, they're signaling that something in their experience broke down. The score tells you where in the journey the breakdown happened, and the follow-up open-ended question tells you what specifically went wrong. Your job is to make sure that signal reaches the people deciding what goes on the roadmap.
Don't let CX data live in your survey tool in isolation. Route it into the same system where your team tracks feature requests and bug reports.
Group low-score feedback by theme rather than treating each response as a standalone data point. If ten users rate your onboarding effort a 2 out of 7 on CES and all ten mention the same setup step, that's a prioritization argument, not just noise. When patterns like this surface consistently, they carry more weight in product discussions than a single loud request from one high-value account.
Not every dip in a CX score requires a new feature. Sometimes a low CSAT score after a support interaction points to a documentation gap, not a product problem. A drop in NPS following a pricing update might need a communication fix before a product fix. Diagnosing the root cause before you assign resources keeps your team from building solutions to the wrong problem.
When CES drops on a core workflow, treat it with urgency. Friction in the critical path of your product is one of the fastest drivers of quiet churn, the kind where users simply stop logging in without ever submitting a cancellation request. Cross-referencing low CES scores with drop-off data from your product analytics gives you the clearest picture of where to focus next. That combination, survey data paired with behavioral data, is where the most defensible product decisions come from.
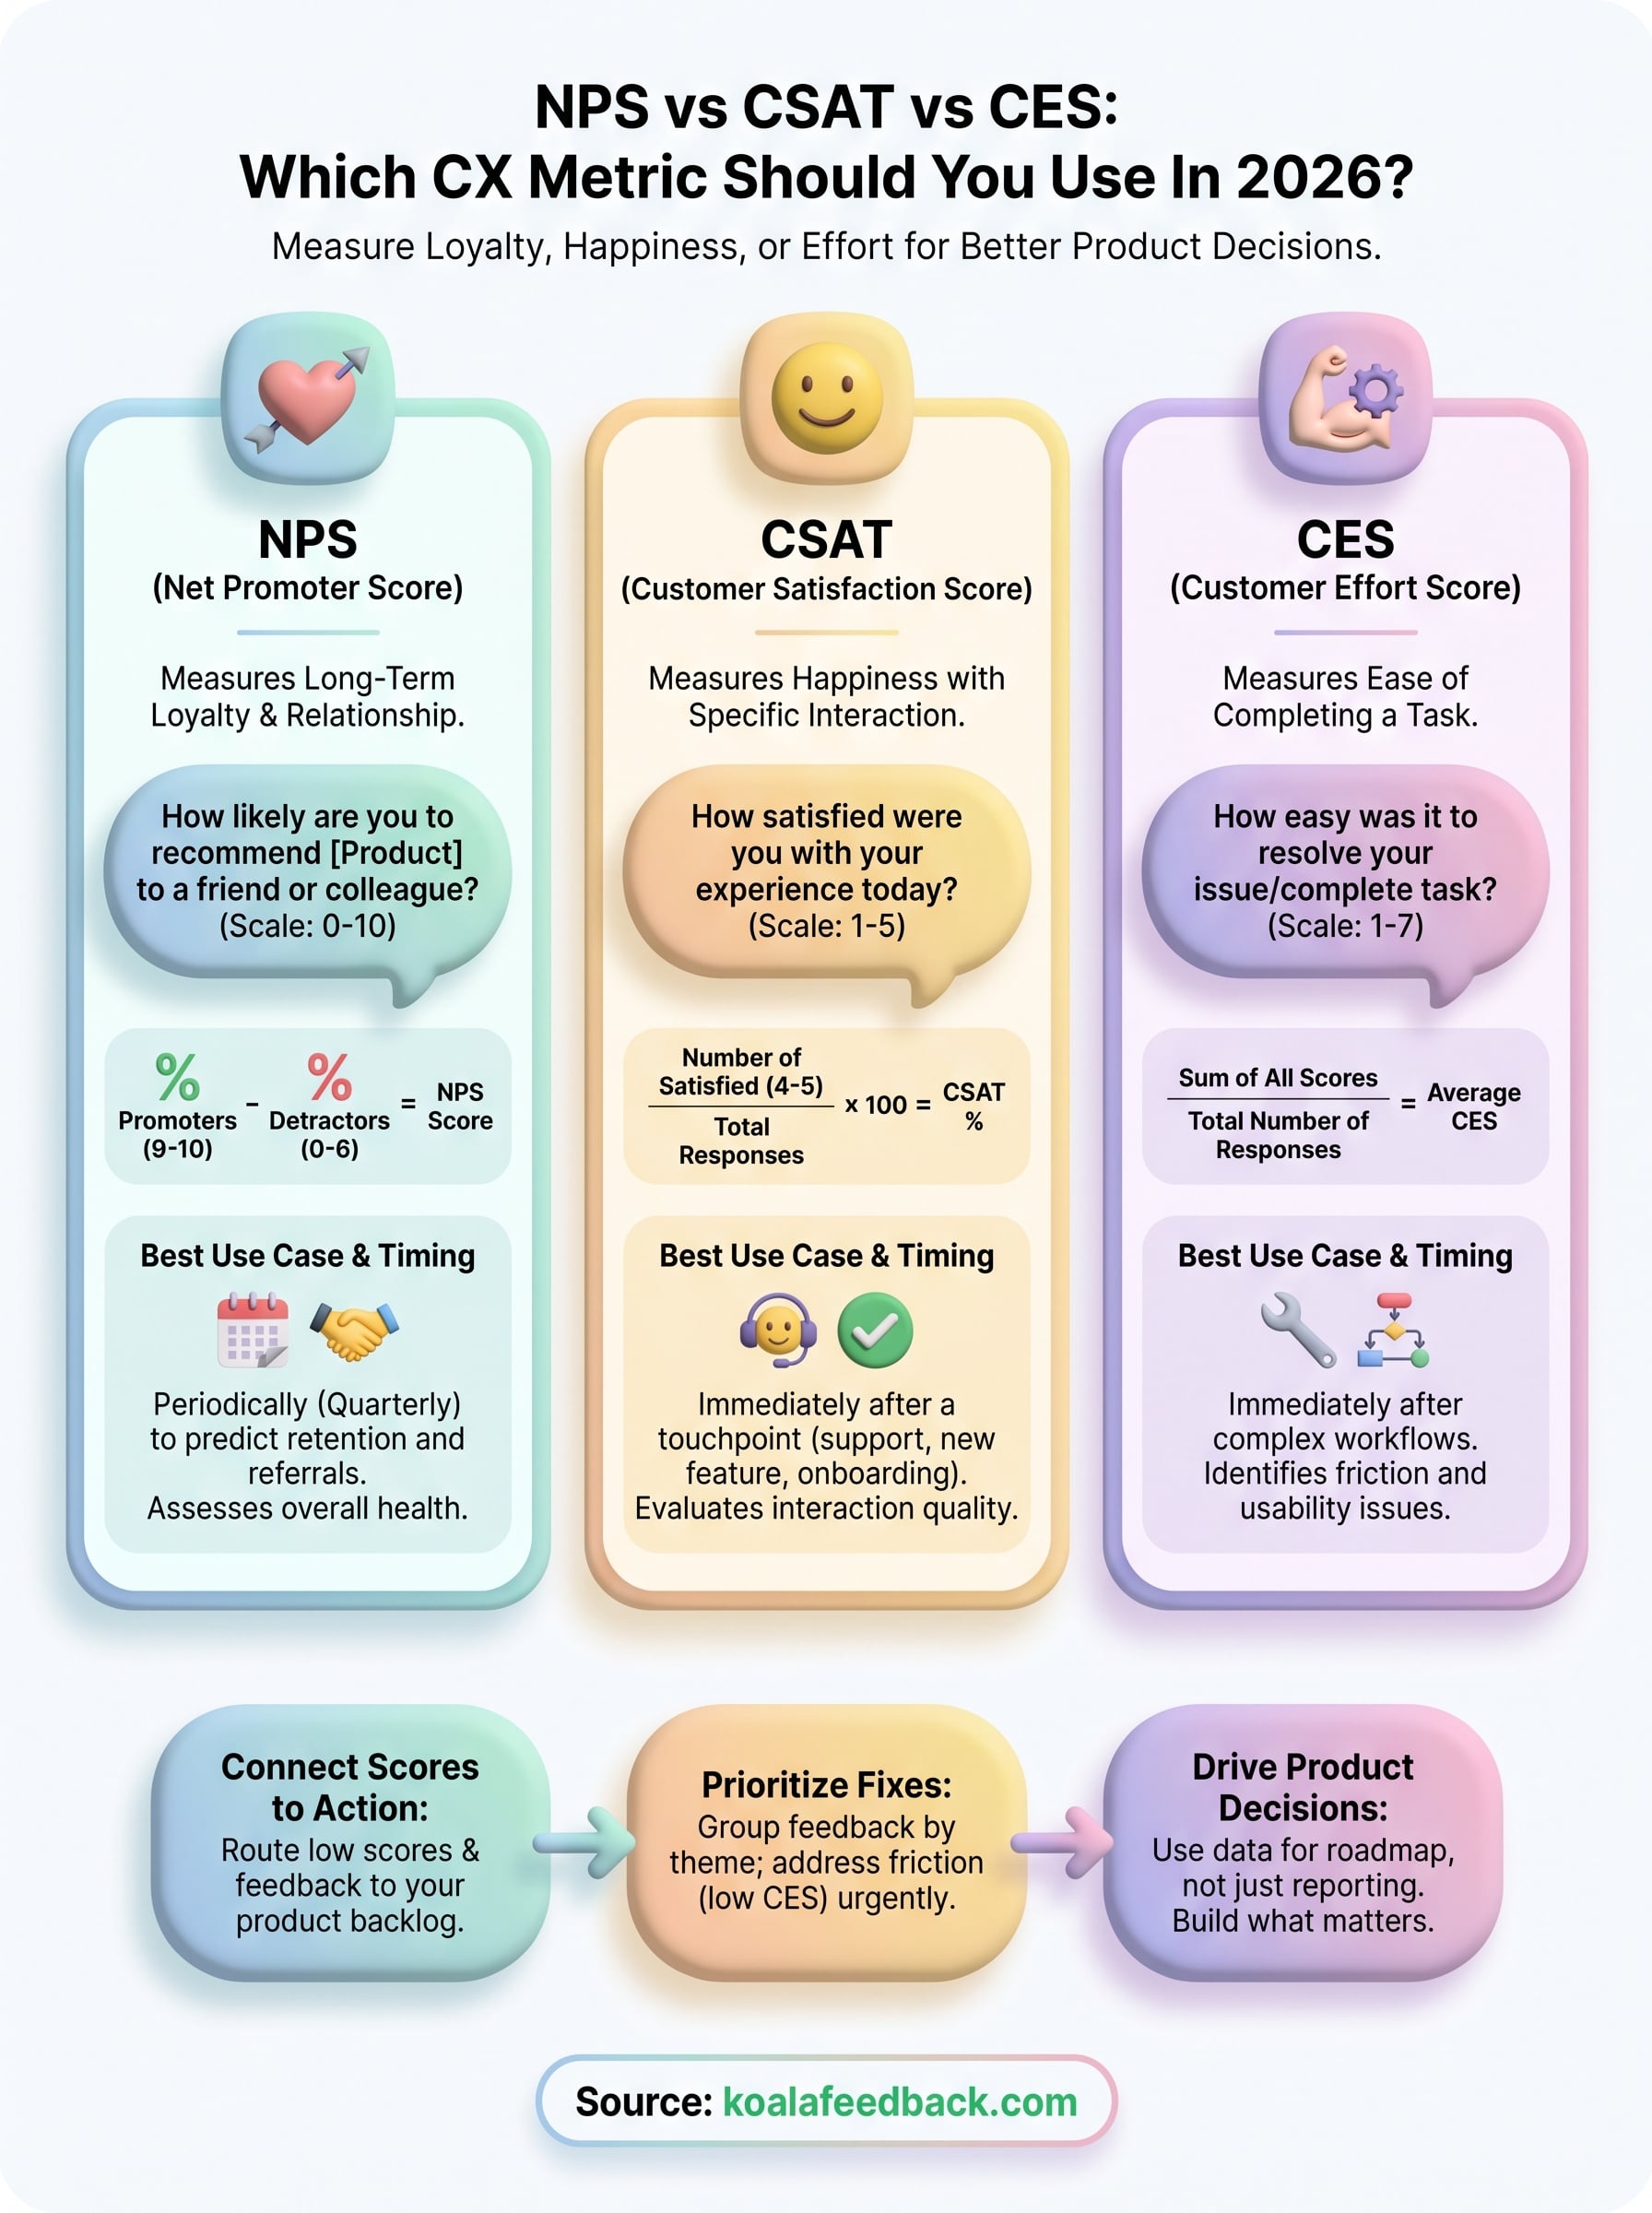
The nps vs csat vs ces debate doesn't have a universal winner. Each metric answers a specific question, and the one you choose should match the decision you're trying to make. NPS tracks loyalty over time, CSAT evaluates individual touchpoints, and CES identifies friction in your workflows. Using all three in the right places gives you a complete picture of where your product is working and where it's pushing users away.
The next move is to stop treating these scores as reporting numbers and start treating them as direct input into your product prioritization process. When users tell you something is hard, satisfying, or worth recommending, that signal should flow directly into how you decide what to build next.
Koala Feedback helps you close that loop by centralizing user feedback, organizing it by theme, and making it easy for your team to act on what your users are actually saying. Start collecting feedback that drives real decisions and build what your users need most.

Start today and have your feedback portal up and running in minutes.