Your customers have opinions about your product. Some will tell you directly, others will just leave. The difference between growing and stagnating often comes down to one thing: knowing how to measure customer satisfaction and actually doing something with that data. Without a clear system, you're guessing, and guessing gets expensive.
The challenge isn't a lack of feedback. It's that most teams collect feedback in scattered places, support tickets, emails, social media, Slack messages, and never connect the dots. You end up with noise instead of signal. Meaningful measurement requires specific metrics, consistent tracking, and a feedback loop that turns raw input into product decisions.
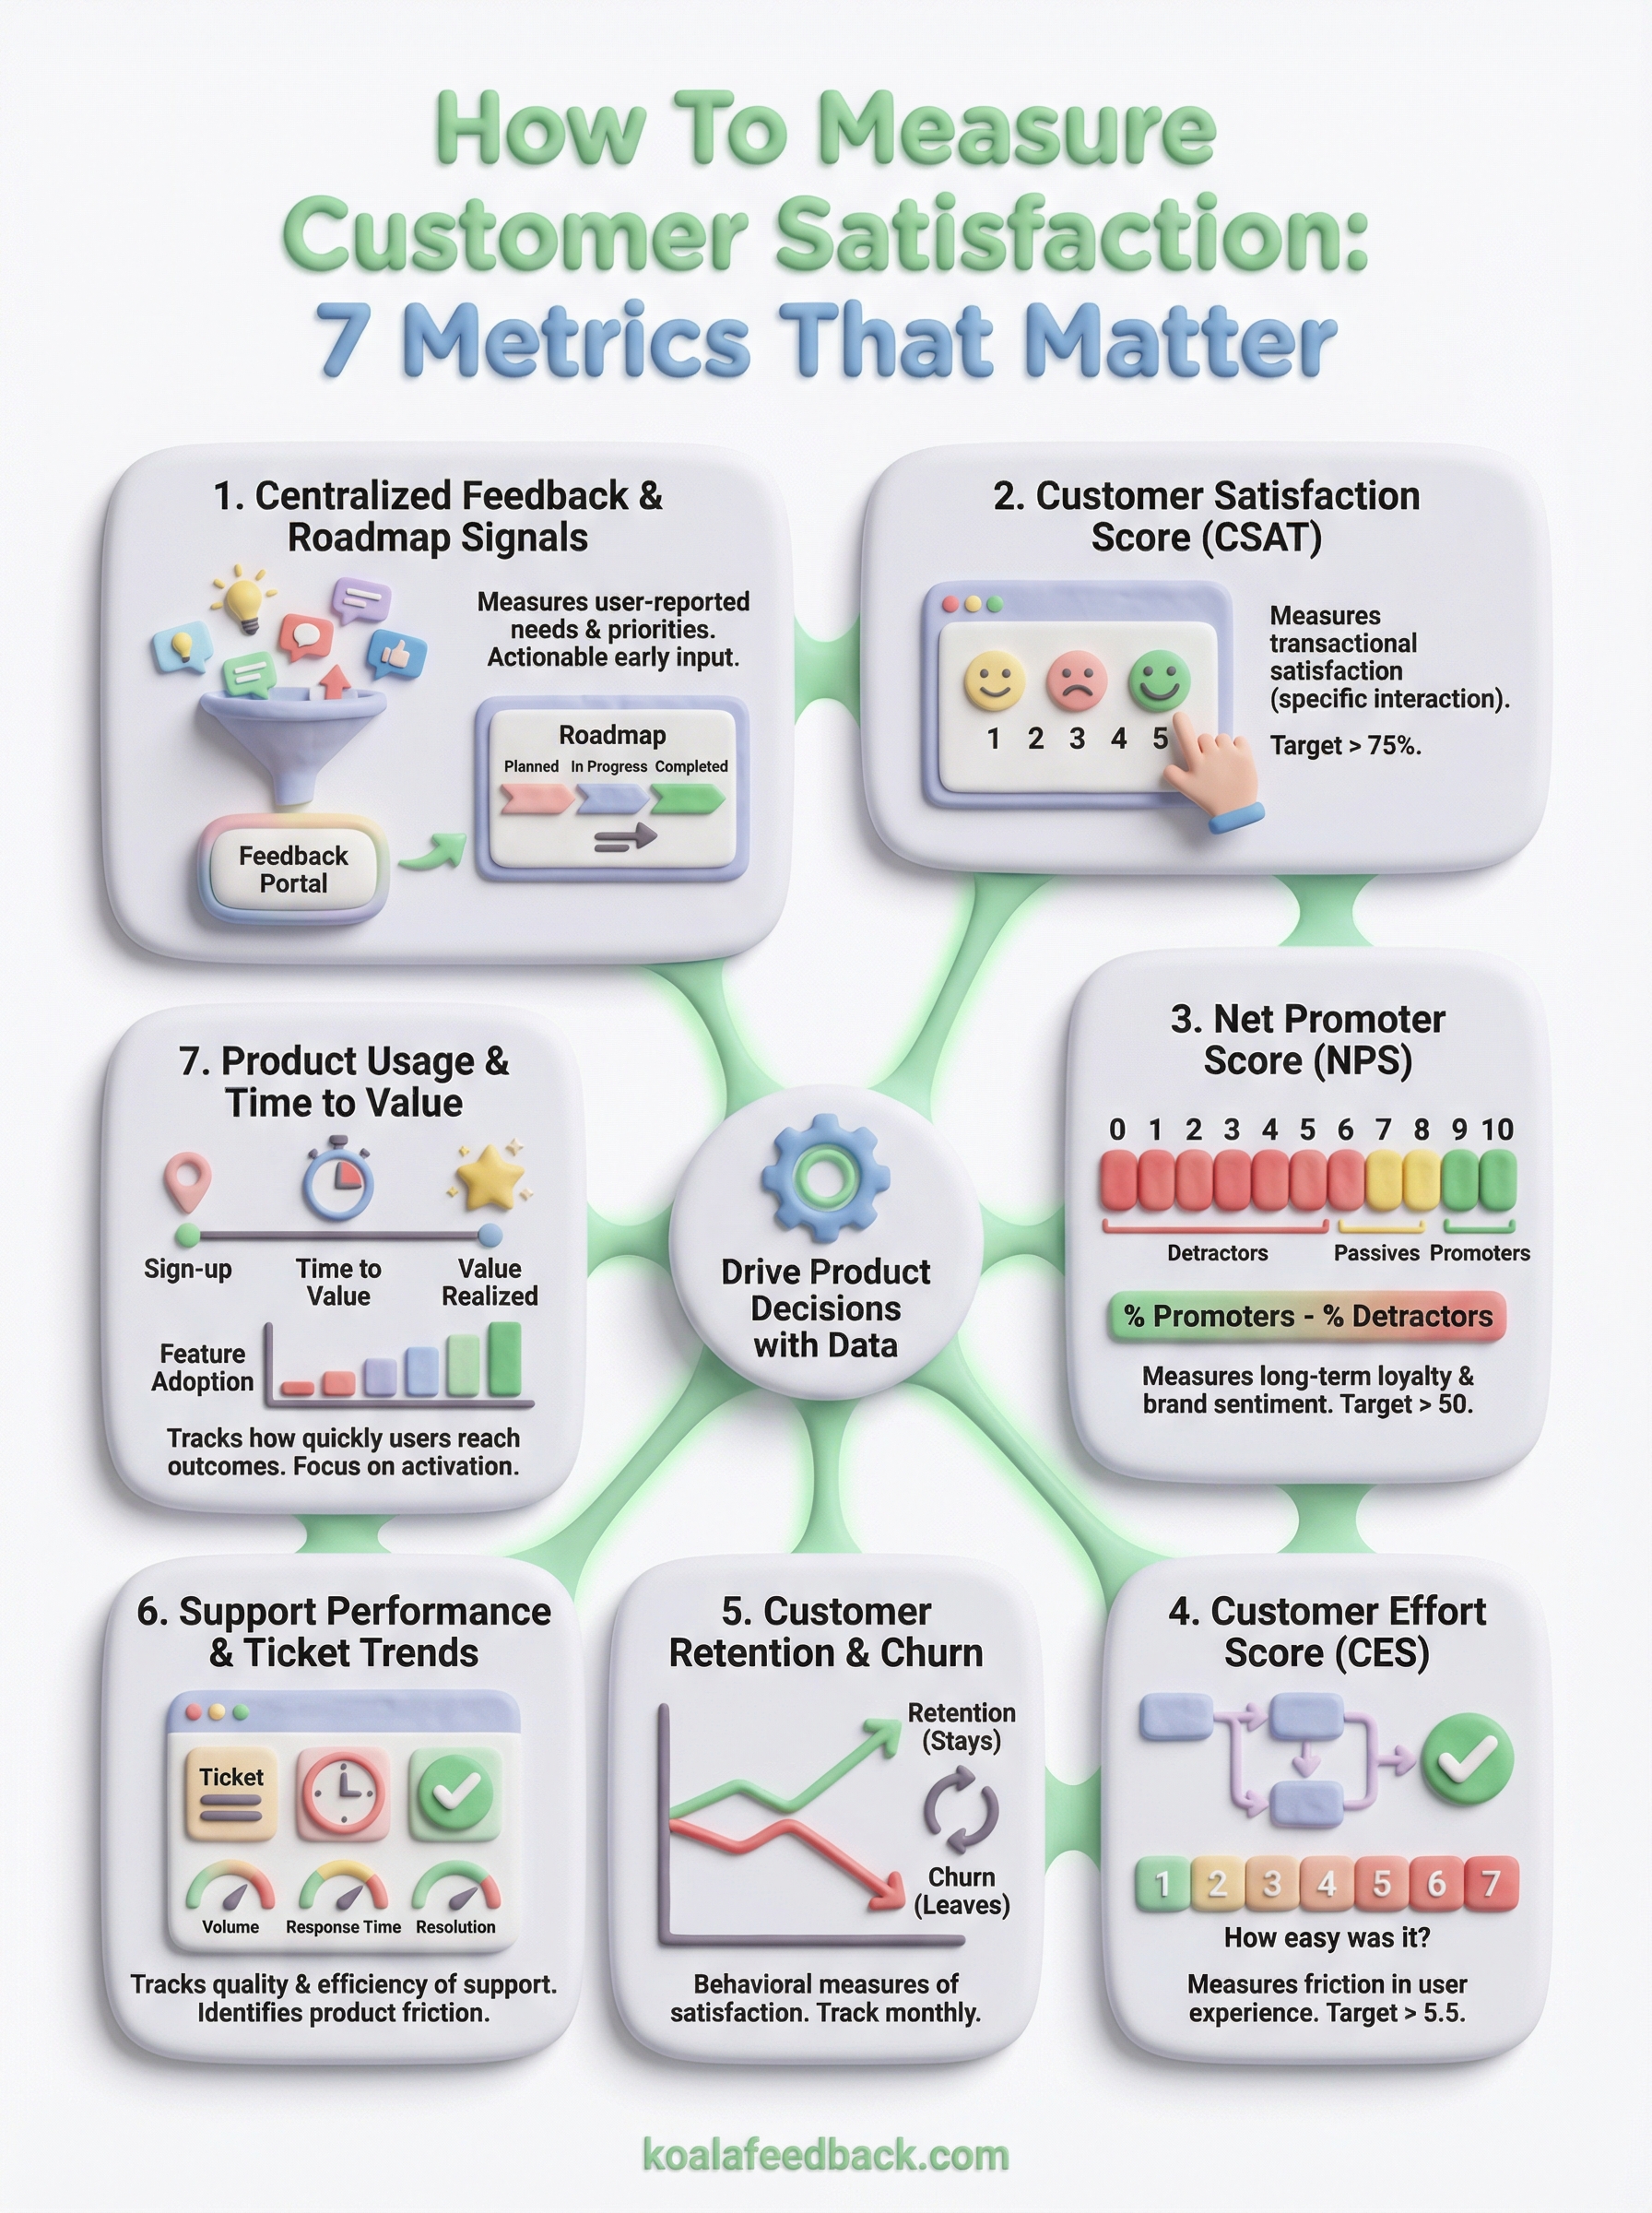
This article breaks down 7 proven metrics for measuring customer satisfaction, from classics like NPS and CSAT to less obvious ones that reveal what your numbers alone won't tell you. You'll learn what each metric actually measures, when to use it, and how to act on the results. And if you're looking for a way to centralize that feedback and prioritize what to build next, that's exactly what we built Koala Feedback to do, giving your users a voice while keeping your team focused on what matters most.
Before you look at survey scores, understand the full picture of feedback your users are already generating. Centralized feedback and roadmap signals measure how well your product aligns with what users actually want, captured through submitted ideas, votes, comments, and roadmap engagement rather than periodic surveys alone.
This metric tracks user-reported needs and priorities across your product: which features people request, how frequently those requests overlap, and how users respond to your public roadmap. It reveals the gap between what you built and what users actually expected.
You also get both qualitative signal (the specific language users use to describe problems) and quantitative signal (vote counts, comment volume), which makes this one of the most actionable early inputs when learning how to measure customer satisfaction.
Set up a dedicated feedback portal where users submit ideas, vote on existing requests, and leave comments. Centralizing this in one place lets you deduplicate similar requests and quantify demand before committing engineering resources. Koala Feedback does this automatically. Key things to track:
Collect feedback continuously, not just after a major release. Ongoing collection lets you catch trends before they turn into churn signals. A cluster of similar requests building across several weeks is an early warning that a real product gap exists.
The best time to learn what users want is before they've decided to look elsewhere.
Look at vote counts and comment volume as proxies for priority. A single request with 80 votes carries more signal than 10 requests with 2 votes each. If requests cluster around one specific area of your product, that often points to a larger structural problem worth addressing before anything else.
Make your roadmap visible and responsive. When users see their feedback acknowledged and moved through stages, planned, in progress, completed, they engage more and churn less. Notifying users when their specific request ships is one of the most underused tactics for building lasting user trust and loyalty.
CSAT is the most direct and immediate way to capture how users feel about a specific product interaction. You ask one simple question: "How satisfied were you with [experience]?" and users respond on a scale, typically 1 to 5. It's one of the most widely used starting points when learning how to measure customer satisfaction.
This metric captures transactional satisfaction tied to a specific moment, like a support interaction, onboarding session, or feature launch. It tells you how well you met a user's expectations at that point in time, rather than their overall relationship with your product.
Send a short post-interaction survey as soon as the touchpoint ends. Calculate your score by dividing positive responses (4s and 5s on a 5-point scale) by total responses, then multiply by 100. A score above 75% is generally considered healthy.
Collect CSAT right after key touchpoints: post-support resolution, post-onboarding, or after a major feature release. Timing matters because satisfaction recall fades fast.
The closer you collect feedback to the actual experience, the more accurate and actionable your CSAT data will be.
A declining CSAT score in one area almost always signals a friction point. Compare scores across different touchpoints to identify exactly where the experience breaks down.
Prioritize low-scoring responses immediately. Follow up directly with dissatisfied users since their specific complaints are your clearest signal for where to make targeted improvements.
NPS measures loyalty and overall brand sentiment rather than satisfaction at a single touchpoint. It asks one question: "How likely are you to recommend us to a friend or colleague?" on a 0-to-10 scale. Companies exploring how to measure customer satisfaction at the relationship level often use NPS as their core benchmark.
NPS captures long-term customer loyalty and the likelihood of organic growth. Respondents fall into three groups: Promoters (9-10), Passives (7-8), and Detractors (0-6), giving you a direct read on who advocates for your product and who might be quietly looking for alternatives.
Subtract the percentage of Detractors from the percentage of Promoters to calculate your score. Results range from -100 to +100, and a score above 50 is considered strong for most SaaS businesses.
Run NPS surveys on a recurring schedule, typically quarterly, rather than after specific interactions. This builds a consistent baseline you can track over time and act on before problems compound.
A sudden drop between two quarters often signals a product or experience issue before it shows up in your churn data.
Track your score over time rather than treating any single result as definitive. The open-ended follow-up comments reveal far more about where satisfaction is improving or breaking down than the number alone.
Start by converting Passives into Promoters since they're already close to satisfied. Ask Detractors a follow-up question to surface specific complaints, then feed those responses directly into your product feedback process.
CES measures how much work a user puts in to accomplish something with your product. Unlike CSAT or NPS, it skips satisfaction entirely and asks one direct question: "How easy was it to complete this task?" That makes CES one of the most underrated signals in how to measure customer satisfaction at the task level.
This metric captures friction in the user experience, specifically how hard it is to get something done. High-effort interactions predict churn more reliably than low satisfaction scores because users who struggle repeatedly will leave before they tell you why.
Ask users to rate the ease of a specific interaction on a 1-to-7 scale, where higher numbers mean easier. Calculate your CES by averaging all responses. Most teams target a score above 5.5 as a baseline for a healthy experience.
Send a CES survey immediately after key interactions: completing onboarding, resolving a support ticket, or using a feature for the first time. Target friction-prone moments to catch problems before they compound.
If users consistently rate an interaction as difficult, that is a product or process problem, not a communication one.
Low scores in a specific area point directly to unnecessary complexity. Compare CES across different user segments and workflows to find where the most effort concentrates.
Reduce friction by simplifying the steps required to complete high-effort tasks. Even removing one unnecessary click or form field in a key workflow can move your CES noticeably.
Retention and churn are behavioral measures of satisfaction rather than stated ones. When users stop paying or stop logging in, they're voting with their actions, and that data tells you something no survey will.
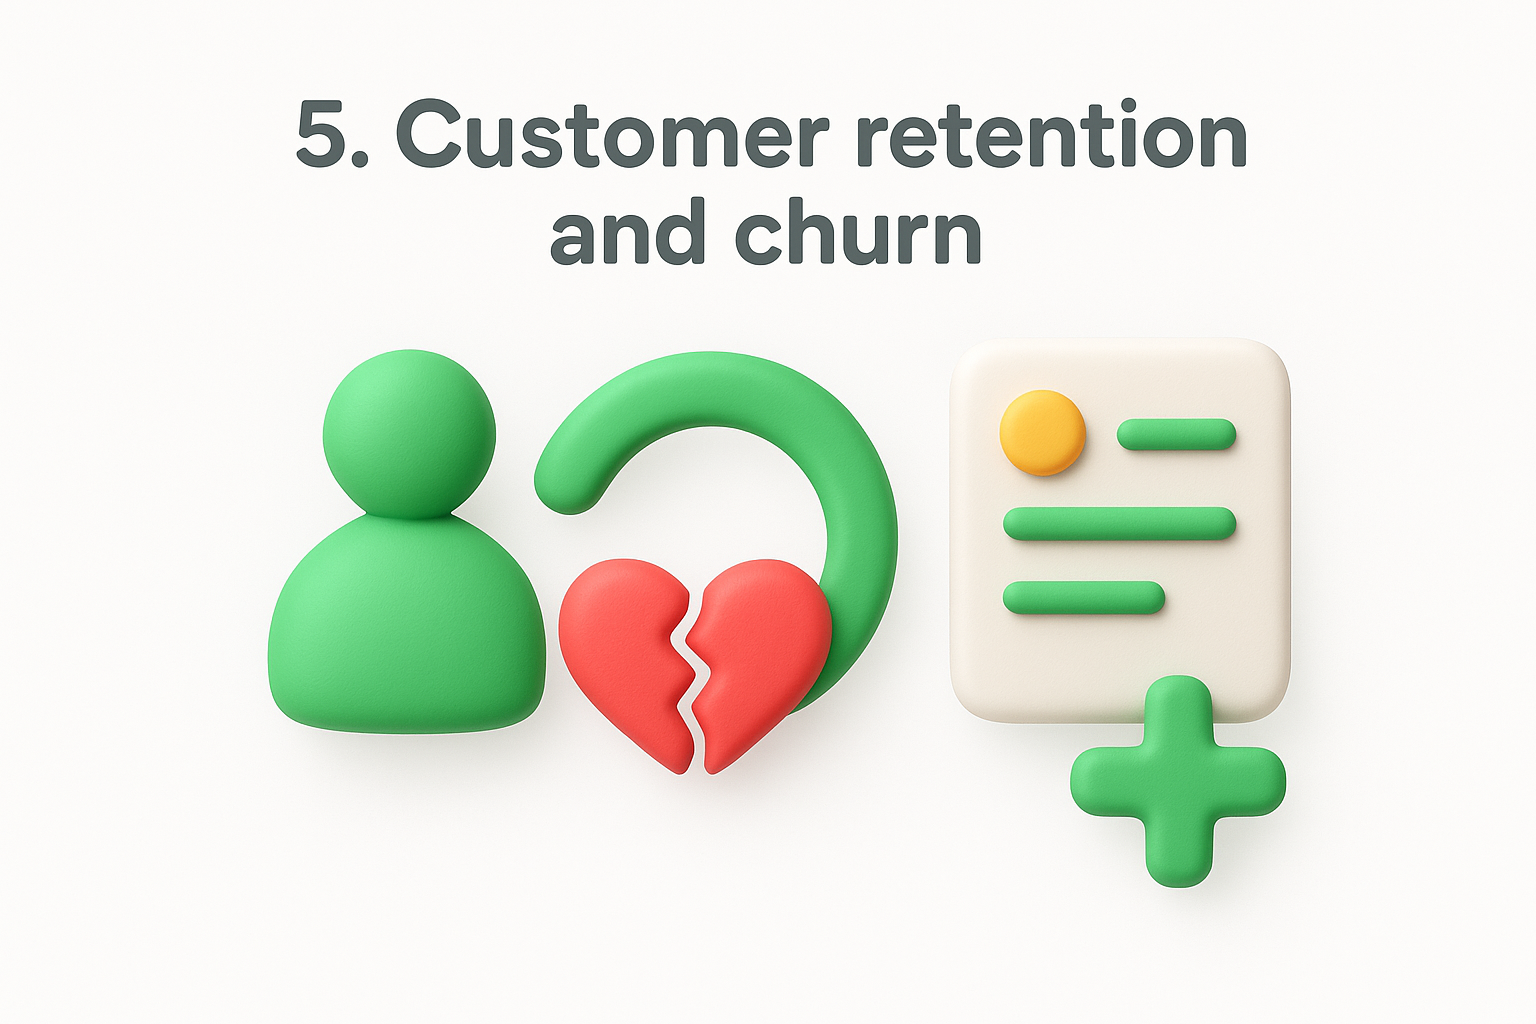
This metric tracks whether users stay or leave over a given period. Churn rate shows the percentage of customers who cancel or stop using your product, while retention rate shows the inverse. Together, they reflect the cumulative result of every experience a user has had with your product.
Calculate monthly churn rate by dividing the number of customers lost in a period by the total at the start, then multiply by 100. Track both revenue churn and user churn separately since losing a high-value customer hits differently than losing a free-tier user.
Monitor retention and churn on a monthly basis at minimum. For SaaS products with shorter billing cycles or free trials, weekly tracking gives you faster signals on whether onboarding changes are working.
A spike in churn right after a product update is one of the clearest signals that something in the change disrupted your users' workflow.
Segment churn by user cohort, plan type, and acquisition channel to find patterns. If users from one segment churn consistently at the 60-day mark, you have a clear window to investigate what breaks down there.
Reach out to churned users directly with a short exit survey. Their reasons for leaving are some of the most honest input you'll ever get on how to measure customer satisfaction and where your product falls short.
Your support queue tells you far more than how busy your team is. The volume, type, and resolution patterns of support tickets reflect how well your product meets user expectations, making this one of the most overlooked data sources when thinking about how to measure customer satisfaction.
This metric tracks the quality and efficiency of your support operation alongside recurring problem patterns. High ticket volumes around specific features or workflows signal product friction, not just user confusion.
Track ticket volume by category, first response time, resolution time, and reopened ticket rate. Group tickets by topic to spot which areas generate the most friction across your user base.
Monitor ticket data continuously and review trends weekly. Pay close attention to any spike in volume following a product update or new release, since those moments surface issues fast.
A sudden jump in tickets around one feature after a release is almost always a signal that something broke or confused users more than expected.
Recurring ticket themes around the same feature or workflow point to a structural problem worth fixing at the product level, not just the support level. If your team answers the same question repeatedly, that is a signal to fix the product or documentation.
Share support ticket trends directly with your product team on a regular cadence. When support data feeds into your feature prioritization process, you close the loop between user pain and product decisions.
Product usage data and time to value tell you whether users are actually getting what they came for. If someone signs up but never reaches the moment where your product delivers real benefit, no survey will catch the problem in time. This is one of the most direct ways to understand how to measure customer satisfaction at the behavioral level, because actions reveal what words often don't.
This metric tracks how quickly and consistently users reach meaningful outcomes in your product. Time to value measures the gap between sign-up and the first moment a user experiences a concrete result from using your product.
Identify your key activation event, the specific action that correlates with retention, and track how long it takes new users to complete it. Key data points to monitor include:
Track usage data continuously from day one. The onboarding window is where most value is lost, so early behavioral signals matter far more than later ones.
Users who don't reach a meaningful outcome within their first week are significantly more likely to churn before their next billing cycle.
Low activation rates signal that your onboarding flow or product experience isn't delivering value fast enough. Segment results by user type to find which groups struggle most and where they drop off.
Shorten the path to your key activation event by removing unnecessary steps. Use in-app prompts to steer users toward the specific actions that consistently drive long-term retention.
Knowing how to measure customer satisfaction is only half the work. The other half is building a system that actually captures, organizes, and acts on what you learn. Each metric in this list gives you a different angle on the same core question: are users getting real value from your product, or are they quietly preparing to leave?
Start with two or three metrics that match where your product is right now. If you're early-stage, centralized feedback and activation rates will teach you the most. If you're scaling, NPS trends and churn segmentation become critical. What matters most is that your team reviews this data on a regular cadence and feeds it back into product decisions.
If you want a single place to collect user feedback, track feature requests, and share your roadmap with users, try Koala Feedback. It connects the feedback loop directly to your product process, so nothing useful gets lost.

Start today and have your feedback portal up and running in minutes.
