Every product team eventually hits the same wall: growth has stalled, and nobody agrees on the next move. Should you push harder into your current market, launch a new feature, or go after a completely different customer base? The product-market growth matrix gives you a structured way to answer that question instead of guessing.
Developed by Igor Ansoff, this framework breaks growth into four clear paths: market penetration, market development, product development, and diversification. Each one carries a different level of risk, and each fits a different stage of your business. Once you understand where your product sits on the matrix, deciding what to build or which market to chase next gets a lot less murky.
In this article, you'll get a plain-language breakdown of all four strategies from Ansoff's product market growth matrix, real examples of companies applying each one, and guidance on picking the right quadrant for your situation. If you're already collecting user feedback through a tool like Koala Feedback, you'll also see how that data feeds directly into these strategic decisions, especially for product development and market penetration calls.
Growth without a product growth strategy framework turns into a grab bag of ideas. One person wants to chase enterprise customers, another wants to bolt on a new integration, and a third wants to expand into a new region because a competitor just did. The product-market growth matrix stops that free-for-all by forcing everyone to name the actual bet they're making: are you selling more of what you have to who you already sell to, or are you stepping into new territory? That single distinction changes budgets, timelines, and how much risk your team can stomach.
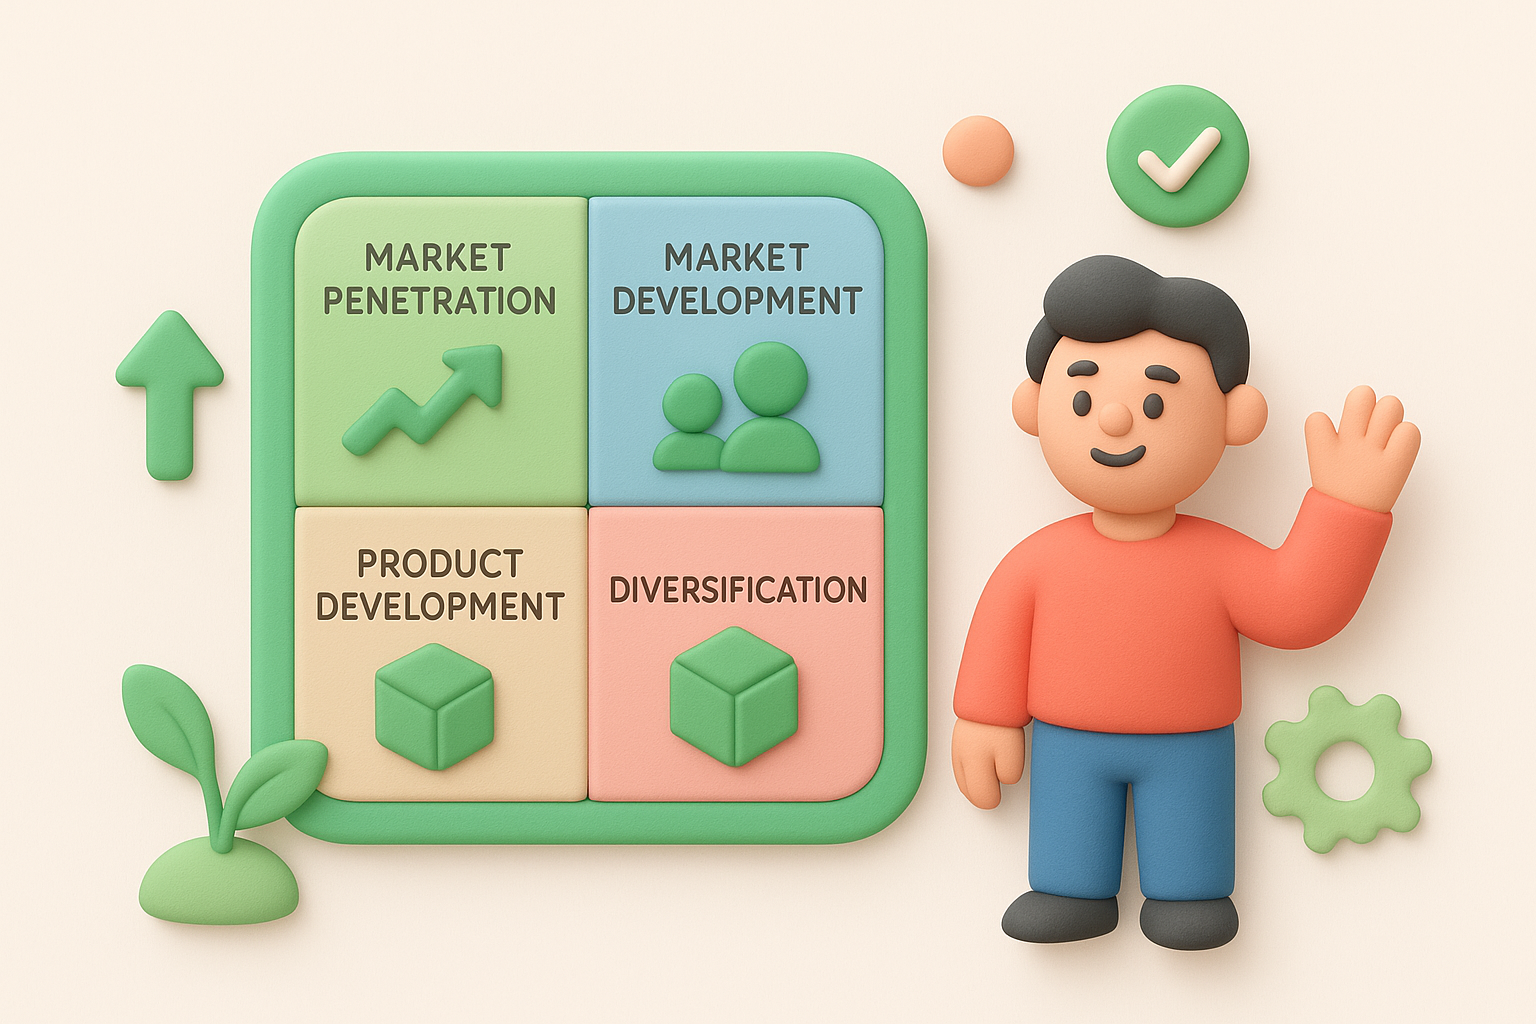
Quantifying risk is where most growth conversations fall apart, because "risky" means something different to a founder than it does to a finance lead. Ansoff's product market growth matrix gives you a shared vocabulary for it. Selling more to existing customers is cheap and predictable. Building a brand-new product for a brand-new market is neither. Laying out the four quadrants side by side makes the risk gap concrete instead of a matter of opinion.
| Strategy | Market | Product | Typical Risk Level |
|---|---|---|---|
| Market Penetration | Existing | Existing | Low |
| Market Development | New | Existing | Medium |
| Product Development | Existing | New | Medium |
| Diversification | New | New | High |
A growth strategy without a risk label attached to it is just a hope.
Roadmaps drift when teams say yes to everything that sounds promising, which is why a deliberate roadmap strategy matters. A product growth matrix gives you a filter: does this initiative deepen your position in a market you already understand, or does it drag you into unfamiliar territory on two fronts at once? Teams that skip this check tend to end up with a roadmap that's half penetration tactics and half diversification bets, with no clear reasoning for either. That's how you burn a quarter building a feature nobody asked for, or entering a market segment your sales team has no relationships in. Sorting initiatives into the matrix before you commit resources exposes those mismatches early, when a conversation is cheap, instead of after launch, when it's expensive.
Getting three departments to agree on "growth" without a shared framework rarely works. Sales might define growth as new logos, product might define it as feature adoption, and leadership might define it as revenue diversification. Applying the matrix gives all three groups a common map to point at. When someone proposes an initiative, you can ask directly: which quadrant is this, and does our current stage of the business support that level of risk? Startups still finding product market fit generally have no business chasing diversification. Mature companies with a saturated core market, far along the product growth stages, often need to look toward it just to keep growing.
A product feedback strategy is the fastest way to figure out which quadrant deserves your attention next. If your existing customers keep requesting the same missing capability, that's a market penetration or product development signal sitting right in front of you. If prospects in a new segment keep asking for features your current product doesn't support, that's a nudge toward market development. Platforms like Koala Feedback exist specifically to surface these patterns: when dozens of users vote on the same feature request, you're looking at real demand data, not a guess about where to grow next. That turns the matrix from a theoretical exercise into a decision backed by what your users are actually telling you.
Understanding the four quadrants is only half the job. Applying the product-market growth matrix means walking through a deliberate sequence: plot where you are, score your options, then commit to one bet at a time instead of chasing all four quadrants at once. Skip the sequence and you end up back where you started, with a pile of good ideas and no way to rank them.
Before you pick a strategy, place your product and your market on the grid as they actually stand today, not as you wish they stood. A team that thinks it's ready for diversification but hasn't even nailed market penetration is setting itself up to fail on two fronts simultaneously. Ask three blunt questions:
Answering these honestly usually rules out at least one quadrant before you go any further.
Once you know which quadrants are realistically in play, score them with a prioritization matrix tool against what you can actually fund and staff. A product market growth matrix only helps if you weigh ambition against capacity.
| Factor | What to check |
|---|---|
| Budget | Can you fund this without cutting core operations? |
| Team capacity | Do you have people who understand this market or product area? |
| Time to signal | How long until you know if this bet is working? |
| Existing data | Does feedback or sales data already support this direction? |
Pick the quadrant your resources can survive, not the one that sounds most exciting.
Teams that try to run market penetration, product development, and market development simultaneously usually dilute all three. Choose one quadrant as your primary growth bet for the next planning cycle, typically a quarter or two, and treat the others as secondary. That doesn't mean ignoring small opportunities elsewhere on the grid, but it does mean your budget, roadmap, and messaging all point in one direction. Revisit the matrix at the end of your quarterly roadmap planning cycle with fresh data, including whatever your feedback portal has surfaced, and decide whether to double down or shift quadrants. Applying Ansoff's product market growth matrix this way turns it into a repeatable planning habit instead of a one-time workshop exercise.
Each quadrant of the product-market growth matrix answers a different question: are you selling to people you already know, or people you don't, and are you selling them what you already make, or something new? Walking through real examples, alongside the broader product growth strategies to scale a SaaS product, makes the distinction concrete instead of theoretical.
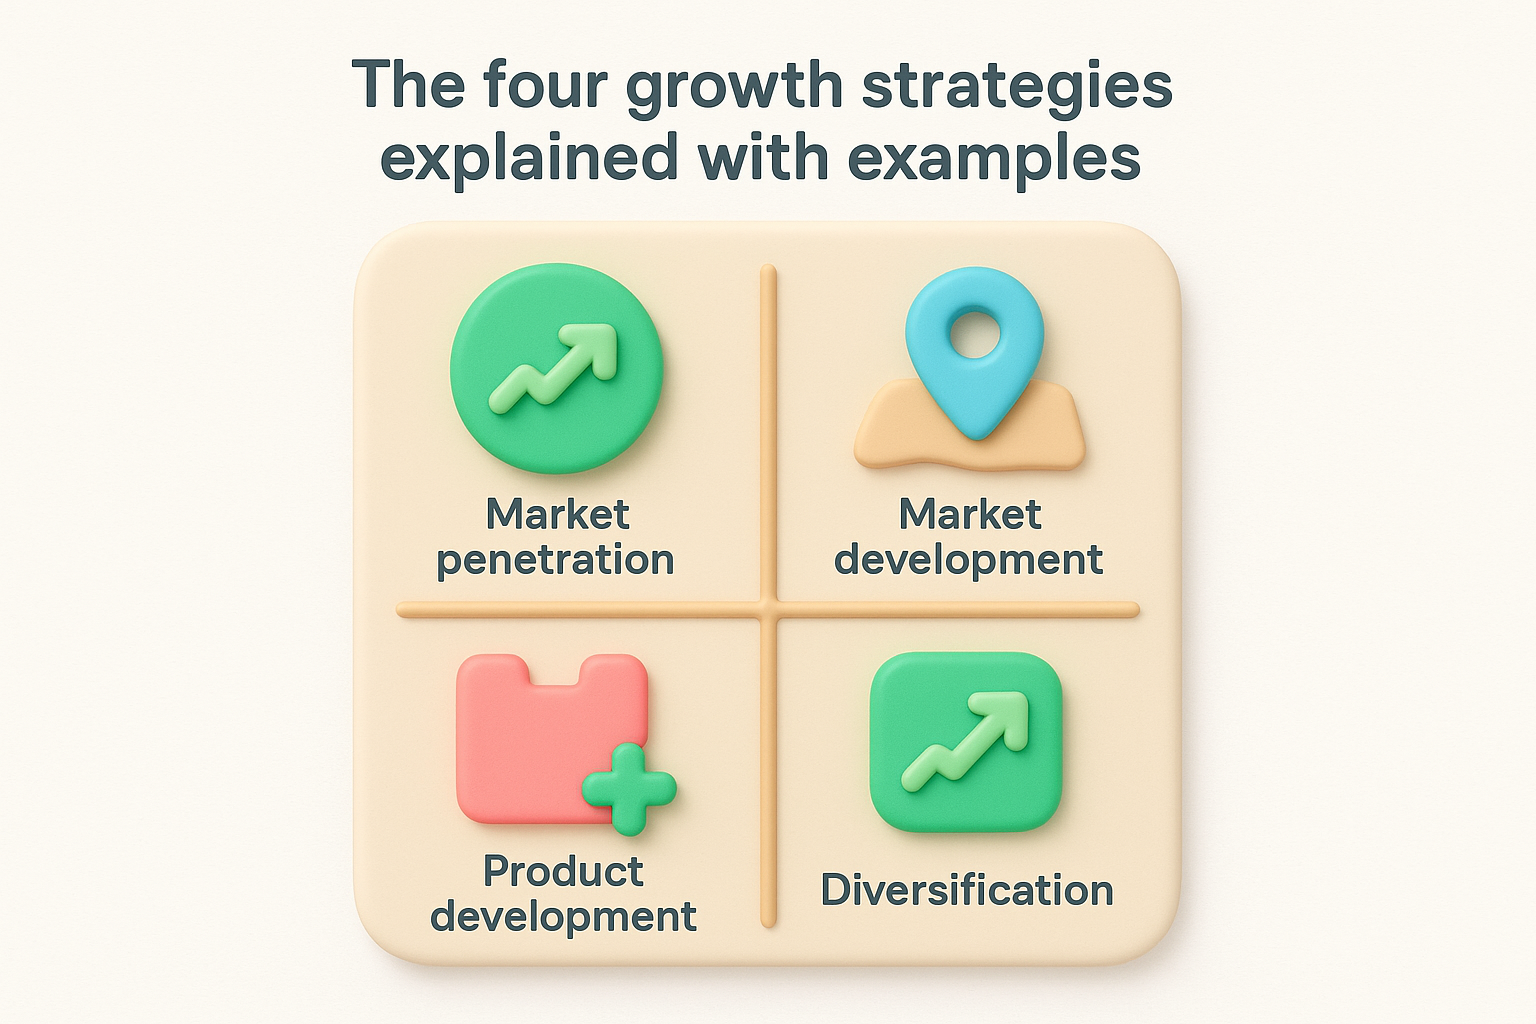
The safest growth bet and the boldest one live on the same chart, and knowing which is which changes everything about your plan.
Market penetration means growing revenue from your existing customers using your existing product, usually through better pricing, more usage, or tighter retention. A SaaS company running a win-back campaign for churned trial users, or adding usage-based upsells inside the app, is playing this quadrant. Costs stay low because you already understand the buyer, and feedback data from current users tells you exactly where friction or missed value is costing you revenue.
Here you keep your current product but push it into a new market, whether that's a new geography, industry vertical, or buyer persona. A project management tool built for marketing teams expanding into agencies is a textbook case. Success depends on product idea validation confirming that the new segment has the same underlying problem, not just a similar-sounding one, before you spend on sales and localization.
Product development flips the formula: you build a new product or feature for your current customer base. This is where feedback portals earn their keep, since managing feature requests piling up from paying customers gives you the clearest signal of what to build next. A note-taking app adding a team collaboration tier because power users kept asking for shared workspaces fits squarely here.
Diversification means launching a brand-new product into a brand-new market, with no existing customer relationships or proven product to lean on. Amazon moving from books into cloud infrastructure with AWS is the classic example of this quadrant done well, though it took years and heavy investment before it paid off. Most companies should treat diversification as a long-term bet reserved for when the core business is stable, not a shortcut around slow growth elsewhere on the matrix.
Mapping your options doesn't require expensive software or a consultant. A one-page worksheet, filled out honestly, gives you everything you need to compare quadrants side by side and defend your choice to leadership. The goal isn't a polished slide deck, it's a working document you can update every planning cycle as new feedback and sales data come in.
Start with a simple grid you can drop into a spreadsheet or doc. Copy this structure and fill in each cell with your own notes before you rank anything:
QUADRANT: Market Penetration
- Current evidence (feedback, sales data, churn data):
- Estimated cost to pursue:
- Estimated time to first signal:
- Risk level (low/medium/high):
- Owner:

QUADRANT: Market Development
- Current evidence:
- Estimated cost to pursue:
- Estimated time to first signal:
- Risk level:
- Owner:

QUADRANT: Product Development
- Current evidence:
- Estimated cost to pursue:
- Estimated time to first signal:
- Risk level:
- Owner:

QUADRANT: Diversification
- Current evidence:
- Estimated cost to pursue:
- Estimated time to first signal:
- Risk level:
- Owner:
Repeating this format for all four quadrants forces you to look at options you'd otherwise ignore, including the ones that feel unglamorous, like plain market penetration.
Once the template exists, resist the urge to fill it in from memory. Pull actual numbers from the ways you already collect product feedback: churn rate for the penetration row, requests tagged by segment for the development row, and vote counts on feature requests for the product development row. If you're running a feedback portal like Koala Feedback, you already have a searchable record of what customers are asking for, which turns the
Used carelessly, the product-market growth matrix turns into a rubber stamp for whatever initiative already has momentum, instead of a real filter. Knowing where the framework breaks down is just as important as knowing how to apply it, because the mistakes below show up in almost every planning cycle.
Teams often fill out the matrix once during an annual planning meeting, then never touch it again. Markets shift, competitors move, and customer needs change every quarter, so a quadrant that made sense in January can look reckless by summer. Revisit your position at least once per planning cycle, using fresh feedback and sales data rather than the assumptions you started with.
A handful of excited emails or a loud voice in a sales call isn't the same as validated demand for a new market or product. Teams chasing market development especially fall into this trap, assuming that because a few prospects in a new segment liked a demo, the whole segment is ready to buy. Cross-check enthusiasm against harder evidence: repeat requests logged in a feedback tool, actual purchase intent, or a paid pilot, before committing budget.
Excitement in a meeting is not the same signal as money on the table.
Each quadrant carries its own risk level, but companies frequently pursue two or three at once without adding up the combined exposure. Running a diversification bet while your core market penetration numbers are slipping means you're gambling on unfamiliar territory with a shrinking safety net at home. Before adding a second bet, confirm your primary quadrant is stable enough to absorb the distraction.
Ansoff's product market growth matrix was designed decades ago for products and markets that moved much slower than software does today. It doesn't account for network effects, freemium funnels and how product-led growth works, or how fast a competitor can copy a feature. Treat it as a starting structure for the conversation, not a complete strategic model, and pair it with real usage and feedback data before locking in a direction.
Some teams debate quadrants in a vacuum, relying on opinion instead of checking what customers have already told them. If you're running a portal like Koala Feedback, that data exists already; pulling it before the debate starts saves a lot of wasted argument.
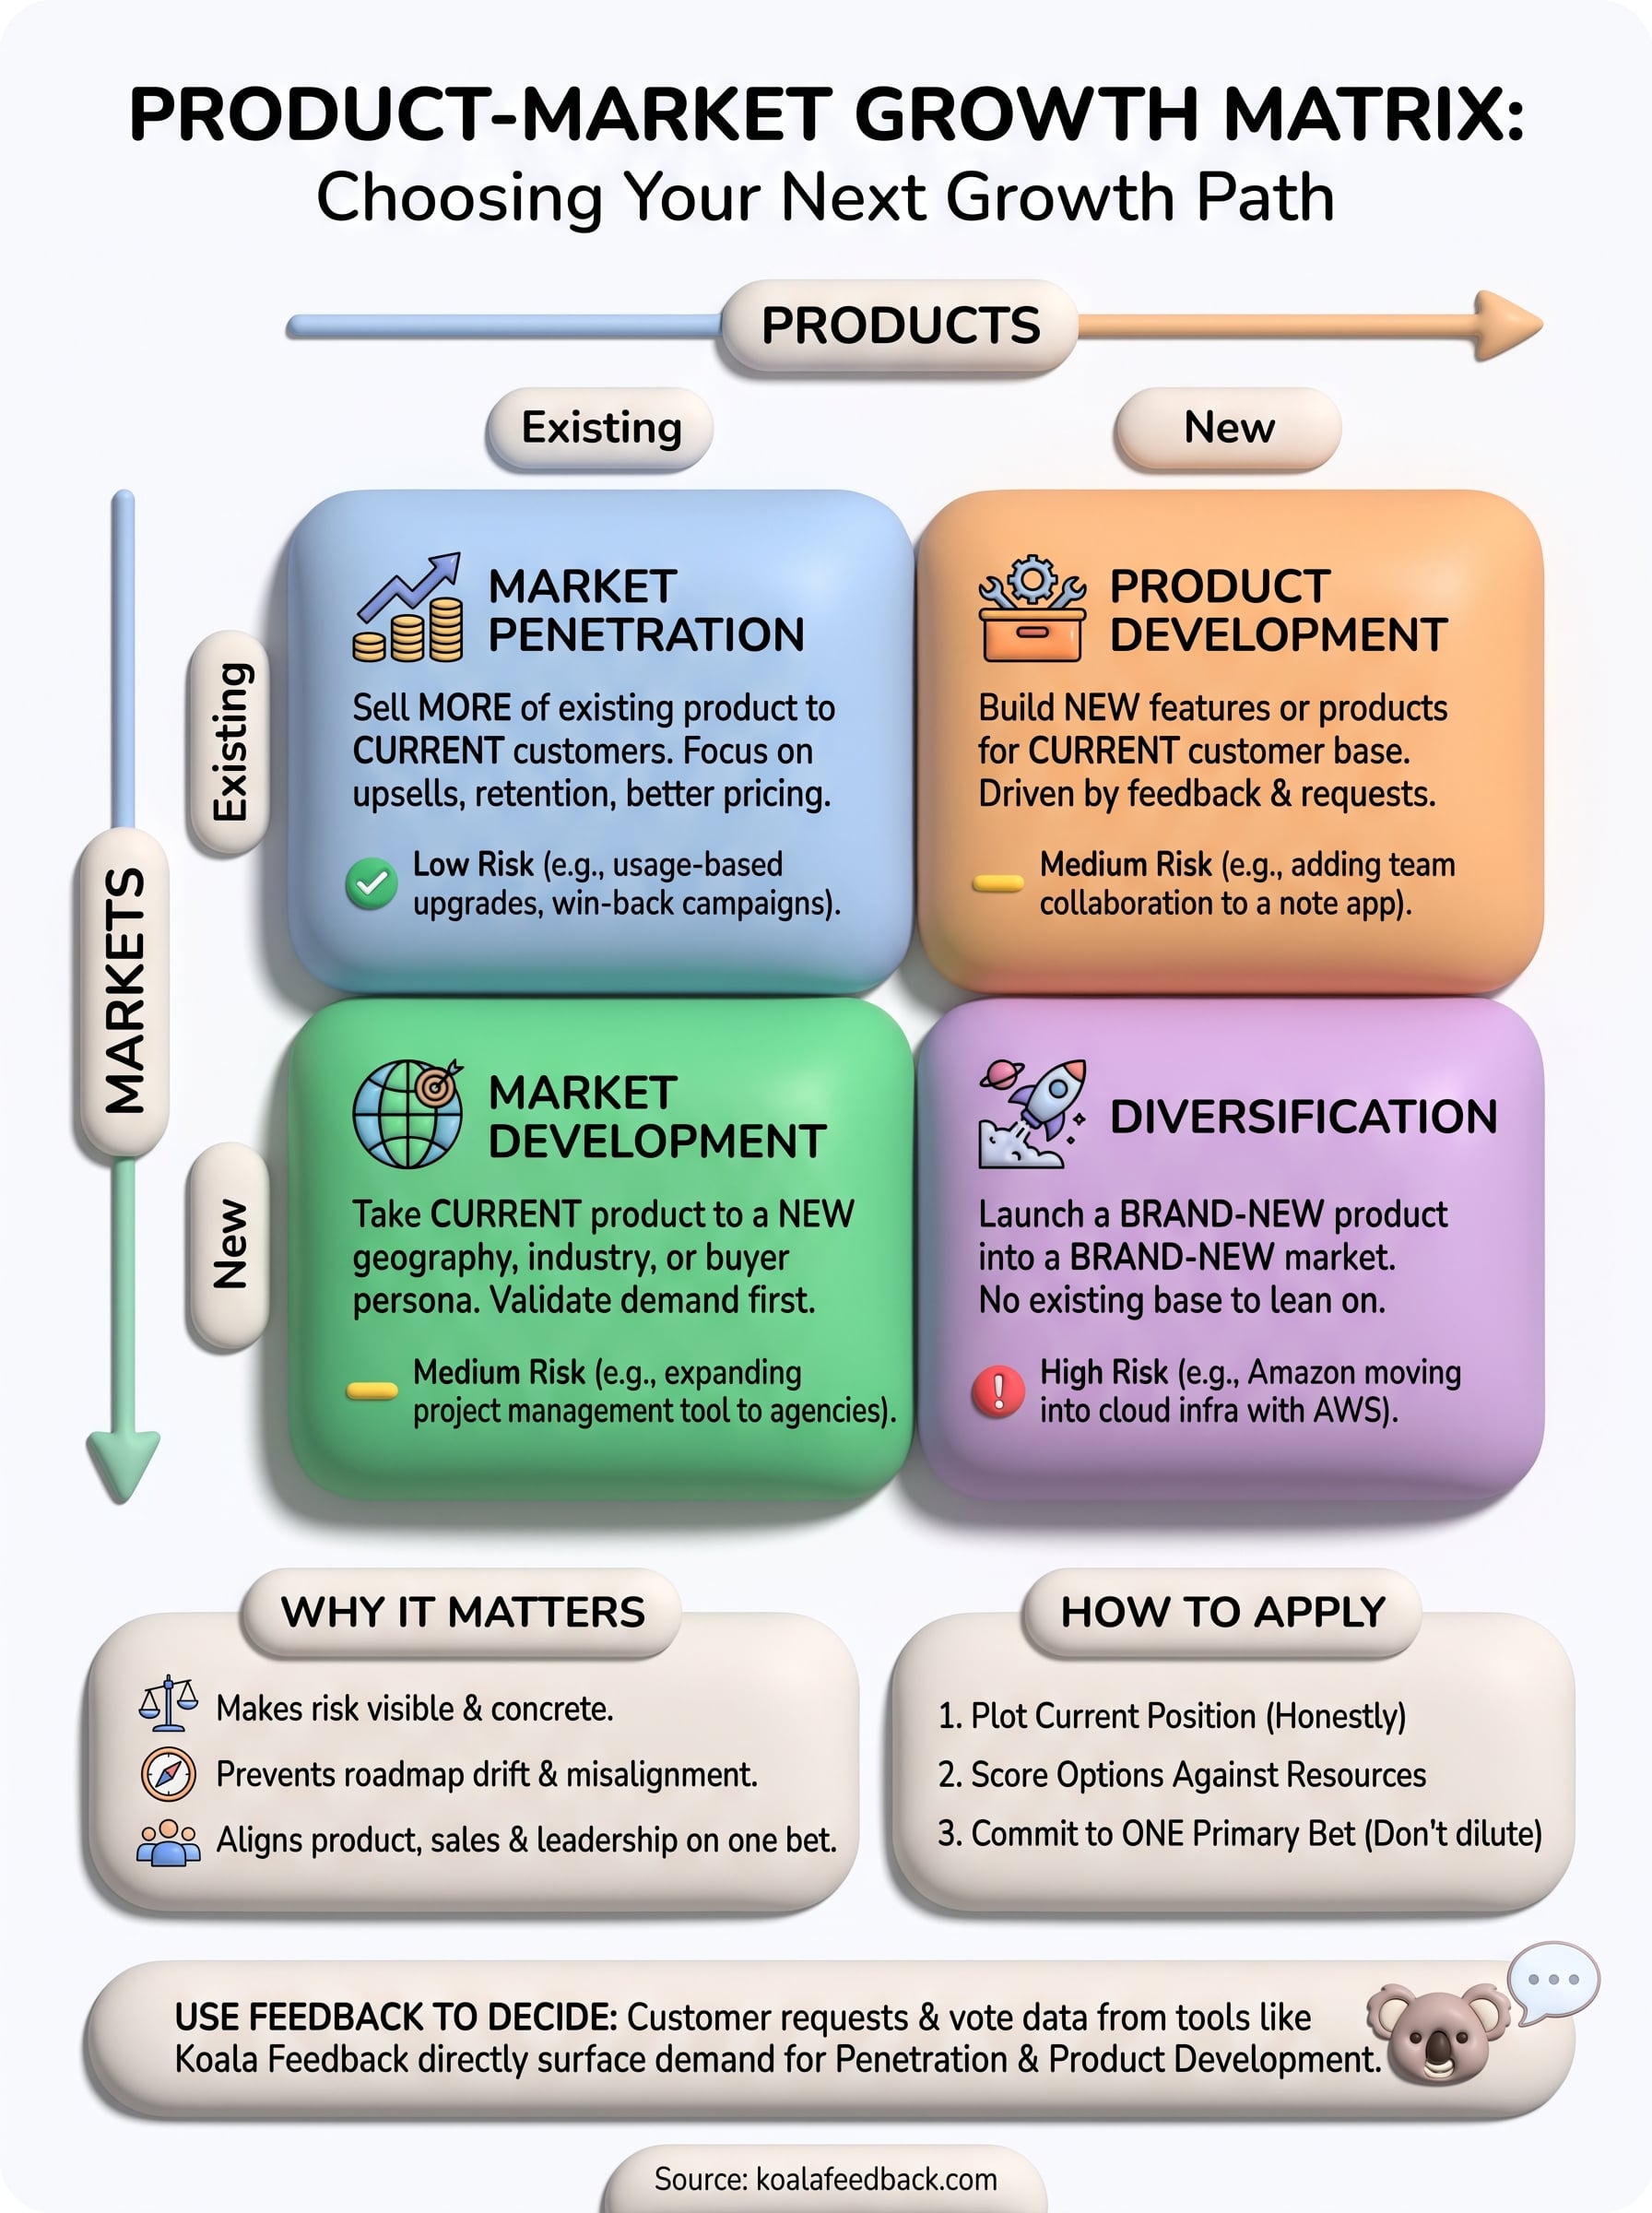
The product-market growth matrix doesn't make the decision for you, but it stops you from guessing. Once you know whether you're chasing existing customers or new ones, and an existing product or a new one, you can rank your options by risk instead of by whoever argued loudest in the planning meeting. Pick one quadrant, fund it properly, and check back at the end of the cycle with fresh evidence before you shift direction.
That evidence matters more than the framework itself. A well-organized product market growth matrix is only as good as the data feeding it, and most of that data is already sitting in your support inbox, sales calls, and feature requests. Instead of guessing what your existing customers want next, centralize those requests and let the votes tell you which quadrant deserves your next quarter. Collect and prioritize user feedback in one place with Koala Feedback, and turn your next growth bet into an informed one.

Start today and have your feedback portal up and running in minutes.