Mixpanel throws hundreds of possible events at you, and it's tempting to track everything. That instinct backfires fast. You end up with dashboards nobody checks and a metrics list that tells you activity happened without telling you whether your product is actually working. Mixpanel product metrics only earn their keep when you pick the ones tied to real user behavior and business outcomes.
This article answers the practical question every product team asks eventually: which metrics actually matter, and how do you set them up correctly inside Mixpanel? You'll get a clear breakdown of retention, engagement, and conversion metrics, plus the exact event structure and reports Mixpanel uses to calculate them.
We'll walk through activation tracking, feature adoption, funnel analysis, and cohort retention, with concrete setup steps rather than vague theory. Along the way, we'll touch on why turning quantitative signals into a feedback loop with real users matters just as much as the numbers themselves, something tools like Koala Feedback help close once you know what to measure.
Product decisions made on gut feeling age badly. A founder or PM might swear a new onboarding flow "feels smoother," but without behavioral data backing that claim, you're guessing. Mixpanel exists to replace that guesswork with actual event trails, showing you what users click, skip, and abandon in real time. When you track the right product metrics, you stop debating opinions in meetings and start pointing at a funnel report that settles the argument in seconds.
Teams that rely on anecdotes tend to overbuild features nobody asked for. Someone requests a dark mode toggle in a support ticket, and suddenly it jumps the roadmap ahead of a broken checkout flow that's quietly bleeding revenue. Mixpanel product metrics force prioritization based on actual usage volume rather than the loudest voice in the room. A feature adoption report showing 2% of users touched a tool in 90 days tells a very different story than a single enthusiastic email.
If you can't measure how users behave inside your product, you're managing it by assumption, not evidence.
Retention curves and engagement drop-offs surface trouble long before support tickets pile up or subscriptions get canceled. Say your weekly active user count is climbing, but your Day-30 retention curve is flattening at 15%. That combination usually means marketing is working while the product itself isn't sticky enough to keep people around. Spotting that gap in Mixpanel gives you weeks, sometimes months, of lead time to fix onboarding, add value earlier, or rework a confusing feature before it shows up as lost revenue.
Product, engineering, and marketing often measure success differently, and that mismatch creates friction. Marketing might celebrate signups while product cares about activation, and engineering just wants fewer support tickets. A shared Mixpanel dashboard with agreed-upon north star metrics removes that ambiguity. Everyone looks at the same funnel, the same cohort retention chart, and the same feature adoption numbers, which makes cross-team planning meetings shorter and far less political.
Here's a quick look at what each stakeholder typically needs from the same underlying data:
| Team | Primary metric of interest | What it reveals |
|---|---|---|
| Product | Feature adoption, retention | Whether the product delivers ongoing value |
| Marketing | Activation rate, signup-to-active conversion | Whether acquired users find value fast |
| Engineering | Error events, drop-off points in funnels | Where technical friction blocks users |
| Leadership | North star metric trend | Overall business health at a glance |
Google's own guidance on data-driven decision making echoes this point: organizations that ground choices in measurable evidence consistently outperform those that don't, a principle documented in Google's re:Work research on data-driven teams. Mixpanel gives product teams the raw material for that kind of evidence, but only if you set up tracking correctly and choose metrics that map to real outcomes, not vanity numbers that look good in a slide deck but explain nothing about user behavior.
Before any dashboard means anything, you need clean event tracking flowing into Mixpanel. That means naming events consistently (Signup Completed, not a mix of signup, sign_up, and New User), attaching the right user properties, and sending events server-side when possible so ad blockers don't skew your numbers. Skip this step and every report downstream inherits the mess.

Map out your core user actions before you write a single line of tracking code. A simple event might look like this in Mixpanel's JavaScript library:
mixpanel.track("Feature Used", {
  feature_name: "export_report",
  plan_tier: "pro",
  user_id: "usr_48213"
});
Consistent naming and properties like plan_tier let you slice every report by segment later without re-instrumenting anything.
A metric is only as reliable as the event data feeding it, so fix your tracking schema before you trust a single dashboard.
Mixpanel offers a handful of report types, and picking the wrong one wastes time. Use this as a quick reference:
A metric that looks flat overall can hide a segment that's thriving and another that's collapsing. Break every core report down by plan tier, signup source, or device type before drawing conclusions. Mixpanel's segmentation filters make this a few clicks, not a data export into a spreadsheet, and it's usually where the real insight hides.
Not every event deserves a dashboard slot. Focus on metrics that answer a specific question about user behavior, not ones that just look busy in a report. Below are the core mixpanel product metrics most teams should configure first, grouped by what stage of the user journey they explain.
Activation measures whether a new signup actually reaches the moment your product delivers value, sometimes called the "aha moment." Track this as a funnel from Signup Completed to a meaningful action, like Report Exported or Team Invited. If only 30% of new users hit that milestone within their first session, your onboarding needs work before you spend another dollar on acquisition.
A high signup count means nothing if activation stays low, since unactivated users churn quietly and skew every other metric.
Engagement tells you how often active users return, while retention tells you how long they stick around. Mixpanel's Retention report handles both if you define "active" clearly, usually one core event repeated within a set window.
| Metric | Mixpanel report | What good looks like |
|---|---|---|
| DAU/MAU ratio | Insights, custom formula | Above 20% for most SaaS products |
| Day-7 retention | Retention report | 30-40% depending on category |
| Feature adoption rate | Insights, filtered by feature event | Steady growth month over month |
Conversion metrics connect product usage to business outcomes, which matters most to leadership. Build funnels from trial signup to paid conversion, or from free-tier feature usage to upgrade events. Pair these funnels with revenue properties, like plan_price, so you can see not just how many users convert, but which behaviors correlate with higher-value plans converting faster.
Random metrics scattered across five dashboards don't help anyone make a call. You need a metrics framework, a small hierarchy that connects daily numbers to the outcome your business actually cares about. Without that structure, Mixpanel becomes a data graveyard instead of a decision engine.

Start by choosing a single north star metric that best represents value delivered to users, something like weekly active teams or reports exported per account. Every other metric should explain movement in that number, not compete with it for attention.
A framework without a north star metric is just a pile of charts nobody agrees to act on.
Beneath your north star, group two or three supporting metrics that explain the levers driving it. If weekly active teams is your north star, activation rate and Day-7 retention are your levers. Build this as a simple layered list so anyone on the team can trace cause and effect:
Saving this structure as a Mixpanel dashboard, with the north star pinned at the top, keeps every meeting anchored to the same chart instead of whichever number someone pulled that morning.
Metrics decay in usefulness if nobody owns them. Assign one person to review the north star and its inputs weekly, flagging any metric that moves more than 10% in either direction. Treat that review like a standing meeting agenda item, not an ad hoc glance at a dashboard. Teams that skip this step tend to notice problems only after a quarterly review, by which point churn has already happened. A weekly cadence turns Mixpanel from a reporting tool into an early warning system tied directly to how you prioritize your roadmap.
Even well-intentioned teams sabotage their own mixpanel product metrics by falling into a handful of predictable traps. These mistakes rarely show up immediately, which is what makes them dangerous: you build a dashboard, trust it for months, and only later discover the numbers never meant what you thought.
Total signups, page views, and app downloads feel good to report but rarely predict retention or revenue. A spike in signups from a viral tweet looks impressive until you notice none of those users ever activated. Anchor your reporting to actions that correlate with actual value delivered, not raw traffic counts that inflate a slide deck.
Vanity metrics make a dashboard look busy while telling you nothing about whether your product actually works.
As teams grow, someone inevitably adds Report_Exported alongside the existing Report Exported event, and suddenly your funnel undercounts by 20% without anyone noticing. Lock down naming conventions in a shared document and require a review before new events ship to production.
An average retention rate of 25% might mean every cohort performs similarly, or it might mean your enterprise segment retains at 60% while self-serve users churn almost immediately. Common mistakes here include:
Products evolve, and the event that defined "activation" a year ago might no longer reflect where value actually happens. Revisit your core definitions quarterly, especially after major feature launches, so your framework tracks the product you have today rather than the one you shipped last year.
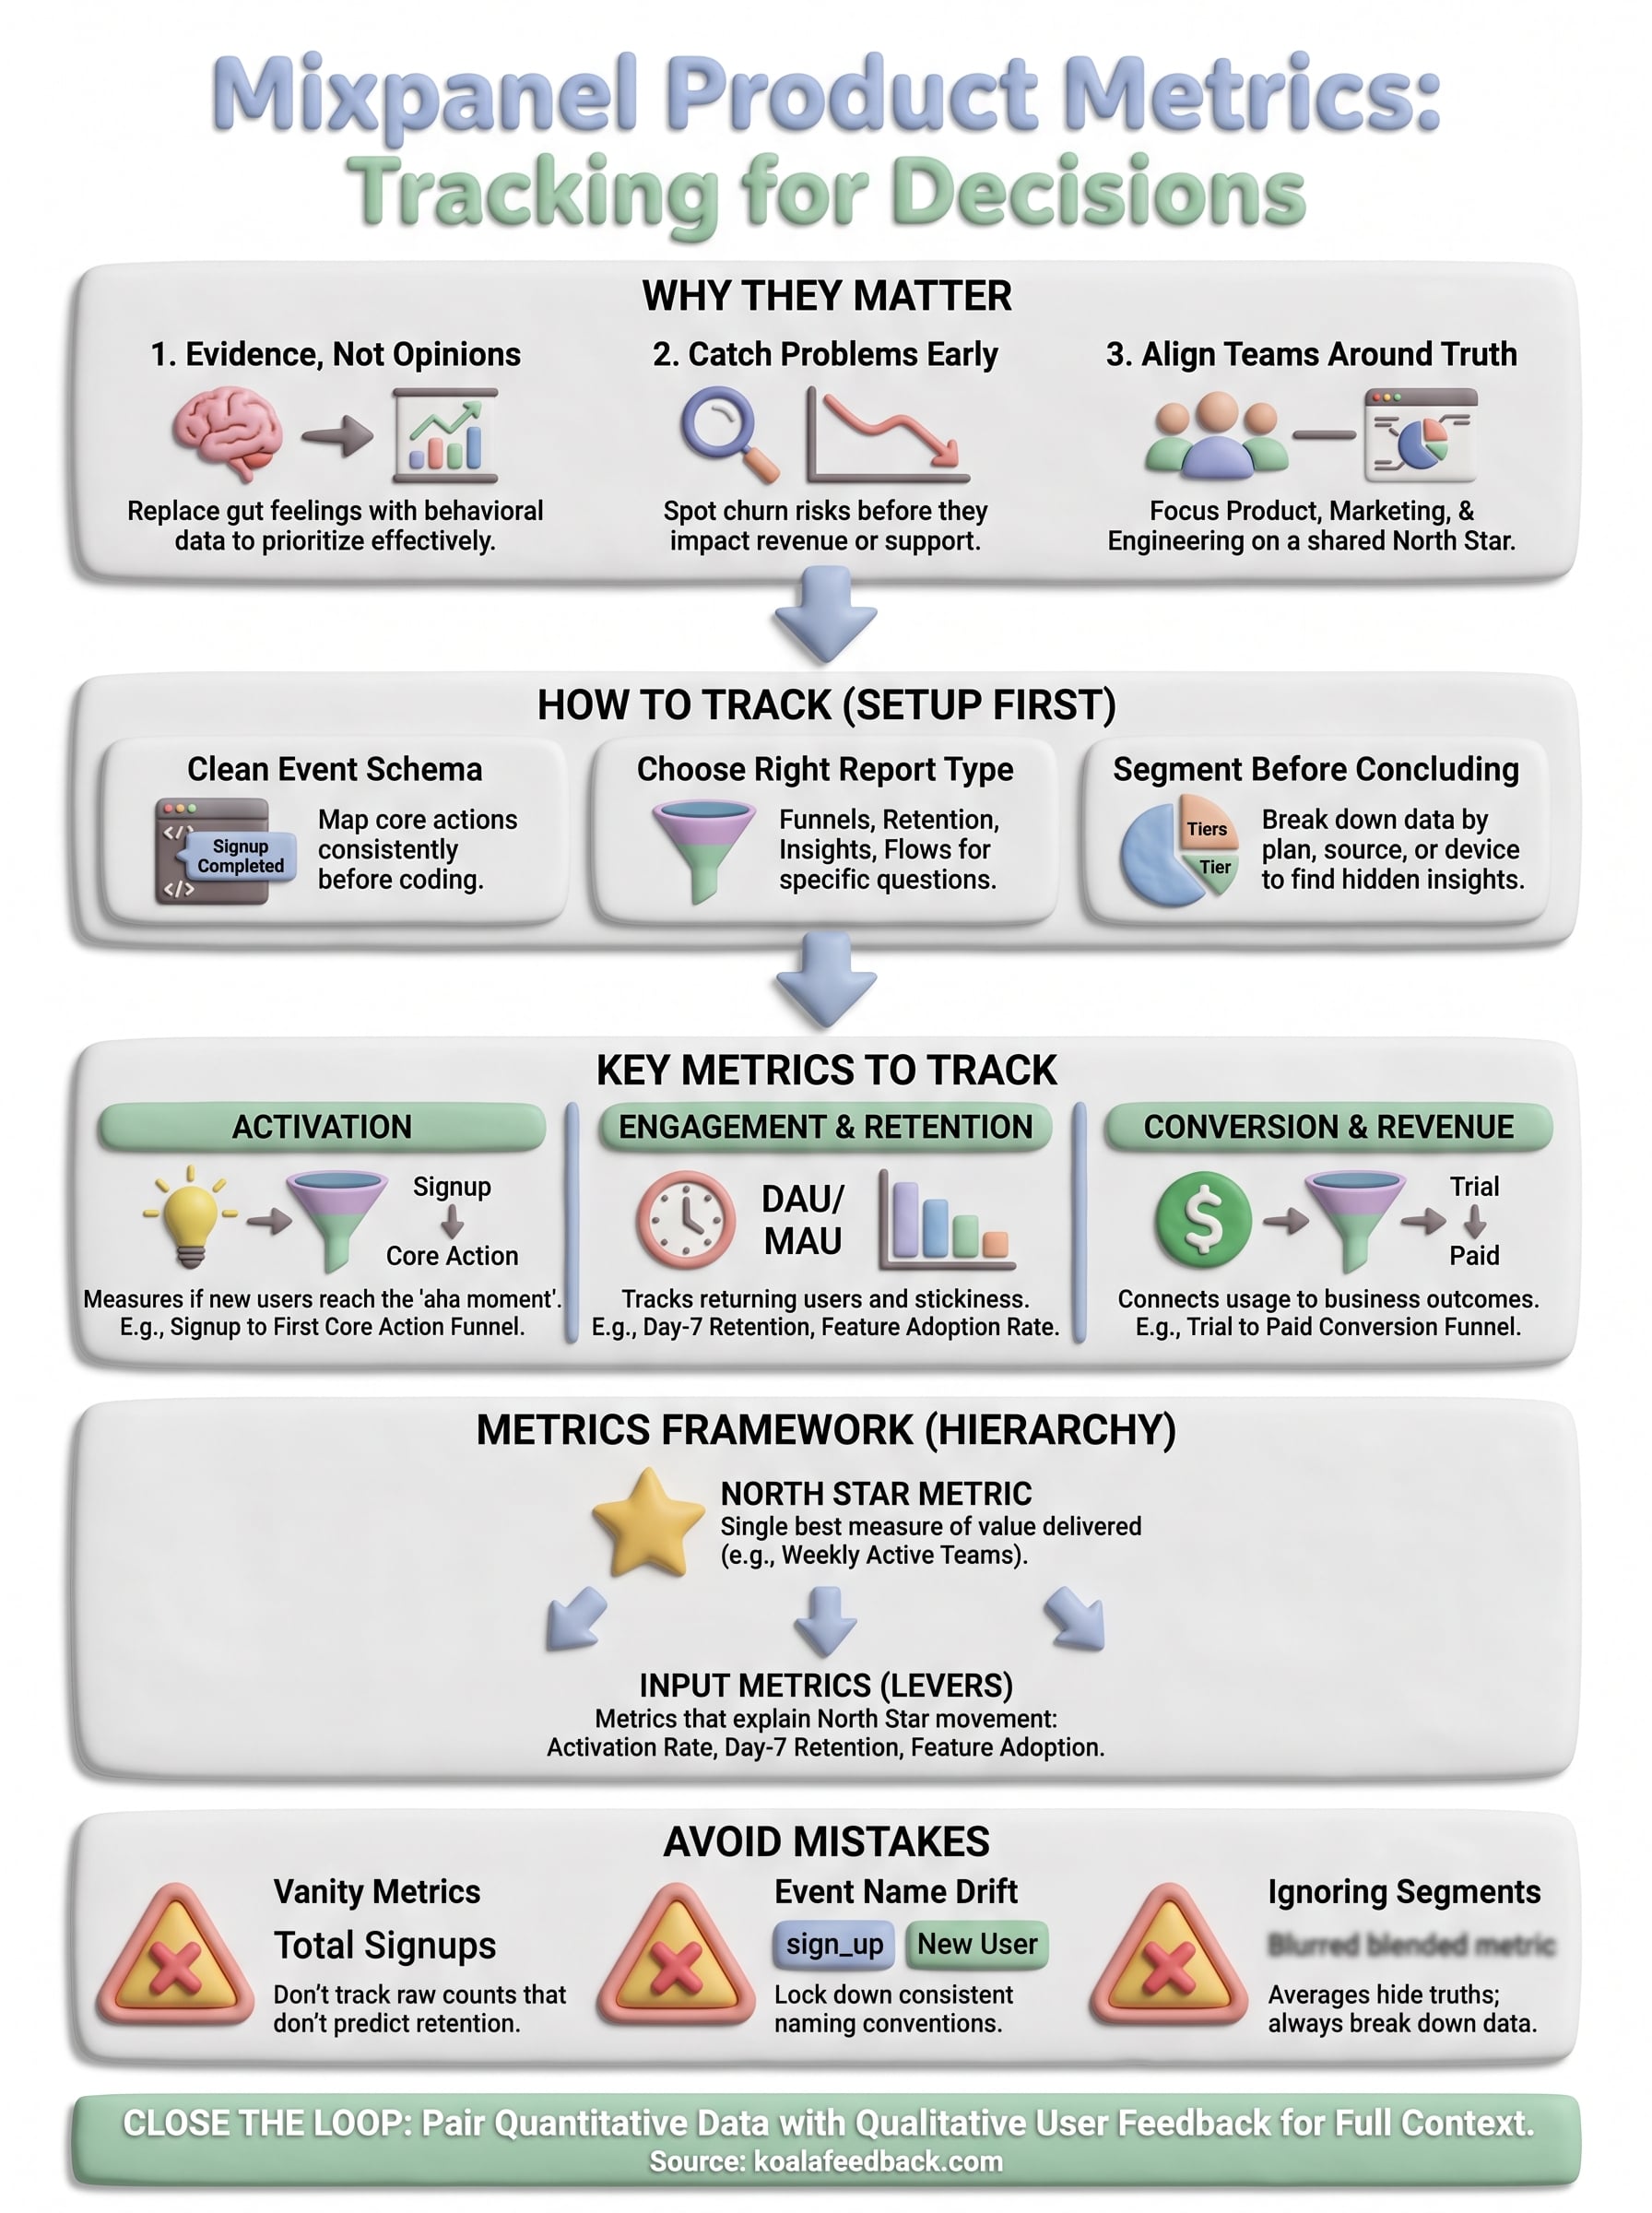
Good tracking only matters if it changes what you build next. Mixpanel product metrics show you where users drop off, which features earn their keep, and whether retention is trending toward a healthy business or a slow leak. That's the whole point: replacing guesswork with a funnel report or a retention curve that settles the debate.
But numbers alone don't tell you why users stall at step three of onboarding or ignore a feature you spent a quarter building. That context comes from the people behind the data. Pair your quantitative signals with direct feedback, so a dip in feature adoption turns into a specific comment about a confusing button, not just a mystery on a chart.
If you're ready to close that loop, set up a feedback portal with Koala Feedback and start hearing exactly why your Mixpanel numbers move the way they do.

Start today and have your feedback portal up and running in minutes.