Product metrics are quantifiable measurements that show how users interact with your product and how those interactions affect your business. They tell you whether people actually use your features, which parts of your product deliver value, and where users get stuck or leave. Think of them as the vital signs of your product. Just like a doctor checks your heart rate and blood pressure to understand your health, you track metrics like activation rate, retention, and feature usage to understand your product's performance.
This guide breaks down everything you need to know about product metrics. You'll learn why certain metrics matter more than others, how to choose the right ones for your goals, and which KPIs successful product teams actually track. We'll cover the main types of metrics, walk through real examples, and show you practical ways to measure and analyze them. By the end, you'll know exactly which numbers to watch and how to use them to build better products.
Product metrics transform how you build and improve your products. Without them, you're making decisions based on gut feelings and assumptions instead of real user behavior. You might think users love a feature because it took months to build, but metrics show they never use it. You might assume your onboarding works fine, but activation rate data reveals 70% of users drop off before completing it. These insights let you fix problems you didn't even know existed.
Metrics also help you prove value to stakeholders and executives. When you pitch a new feature or request resources, hard numbers carry weight. You can show that improving your retention rate by 5% will add $200,000 in annual revenue, or that reducing time to activation will convert 500 more trial users each quarter. Data-driven arguments win budget battles and get projects approved.
Tracking the right metrics helps you understand what users actually do, not what they say they do.
Finally, product metrics give you early warning signals before small issues become major problems. A dip in daily active users, a spike in churn, or declining feature adoption all point to specific areas that need attention. You catch these trends early and respond quickly, rather than discovering problems after significant damage occurs.
Choosing the right product metrics starts with understanding your specific business goals and product stage. You can't track everything, and trying to do so spreads your focus too thin. Instead, you need to identify the few metrics that directly indicate whether you're making progress toward your goals. The key question to ask is: what user behavior best predicts the outcomes we care about?
Your metrics should connect directly to business outcomes you want to drive. If your goal is to increase revenue, track metrics like monthly recurring revenue, average revenue per user, or conversion rates from free to paid. If you're focused on growth, monitor activation rate, retention, and referral rates. Each metric you choose should have a clear line of sight to a strategic objective. When someone asks why you track a specific metric, you should be able to explain exactly how improving it helps the business succeed.
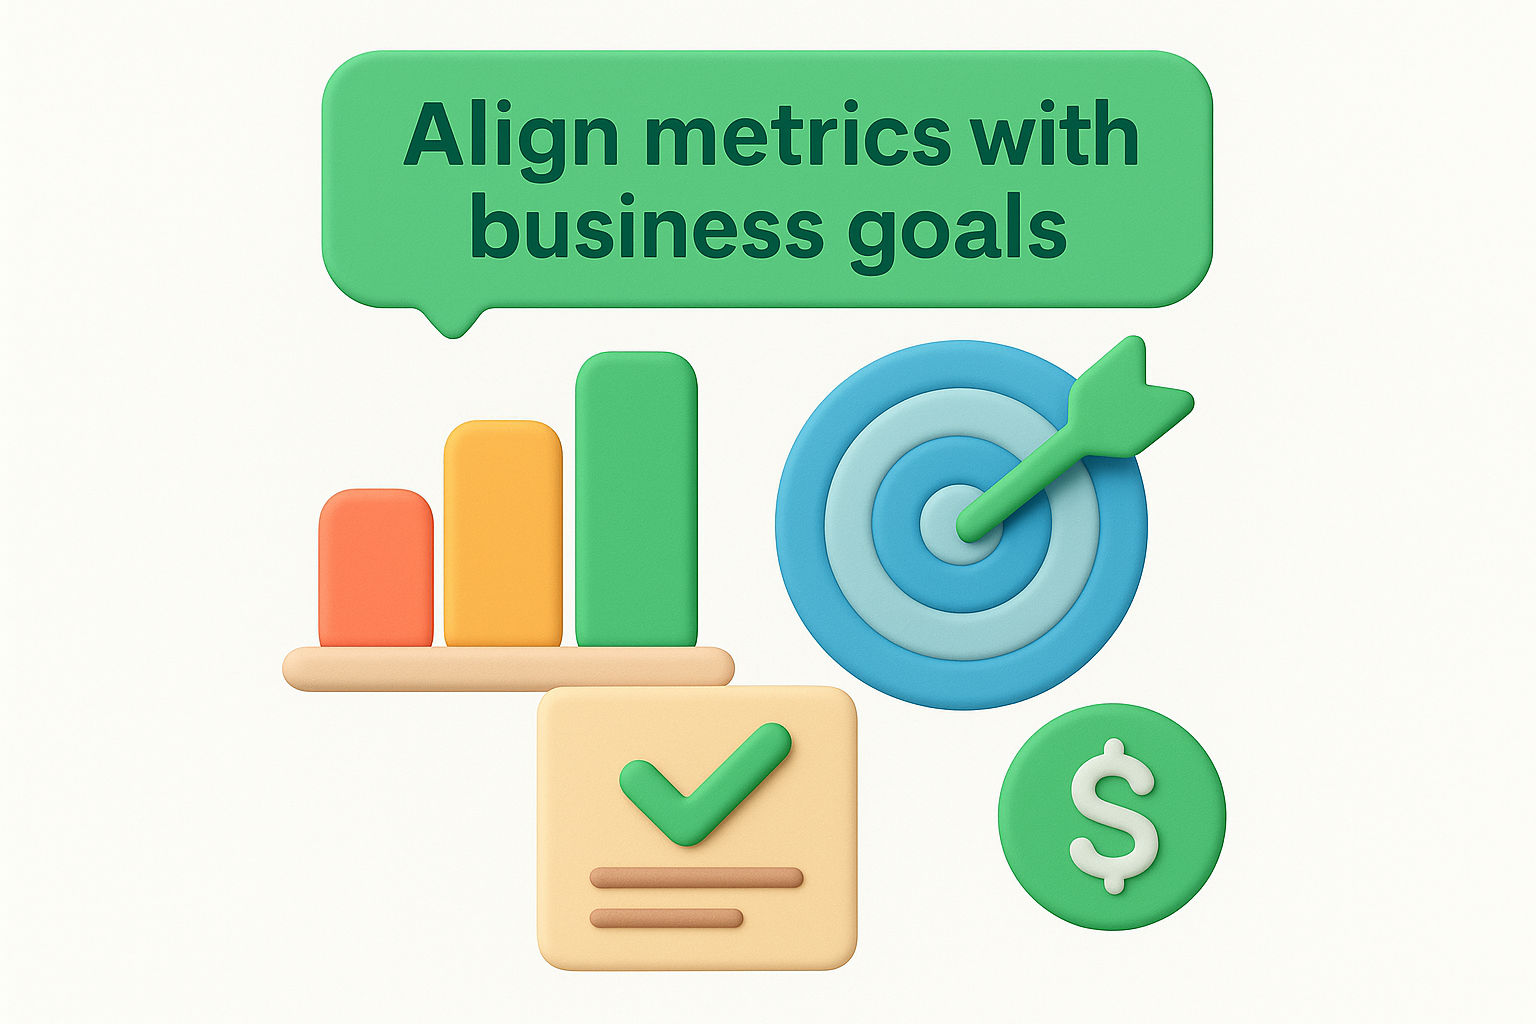
Pick metrics that directly measure progress toward your most important business objectives.
Choose metrics you can actually influence through product changes. Vanity metrics like total page views or email subscribers might look impressive, but they don't tell you what to do next. Actionable metrics reveal specific user behaviors and point to concrete improvements. For example, tracking which features users engage with most tells you where to invest development resources. Measuring time to first value shows you whether your onboarding needs work.
What are product metrics worth tracking changes as your product matures. Early-stage products need to focus on activation and engagement to prove users find value. You track metrics like percentage of users completing key actions and frequency of return visits. Growth-stage products shift attention to retention and monetization metrics that show sustainable business models. Mature products emphasize efficiency metrics like customer lifetime value and acquisition costs to optimize profitability.
Product metrics fall into several categories that correspond to different stages of the user journey and business objectives. Understanding what are product metrics in each category helps you track the complete picture of how users discover, adopt, and continue using your product. Most teams organize their metrics around five core areas: acquisition, activation, engagement, retention, and monetization. Each category answers different questions about your product's performance and reveals specific opportunities for improvement.
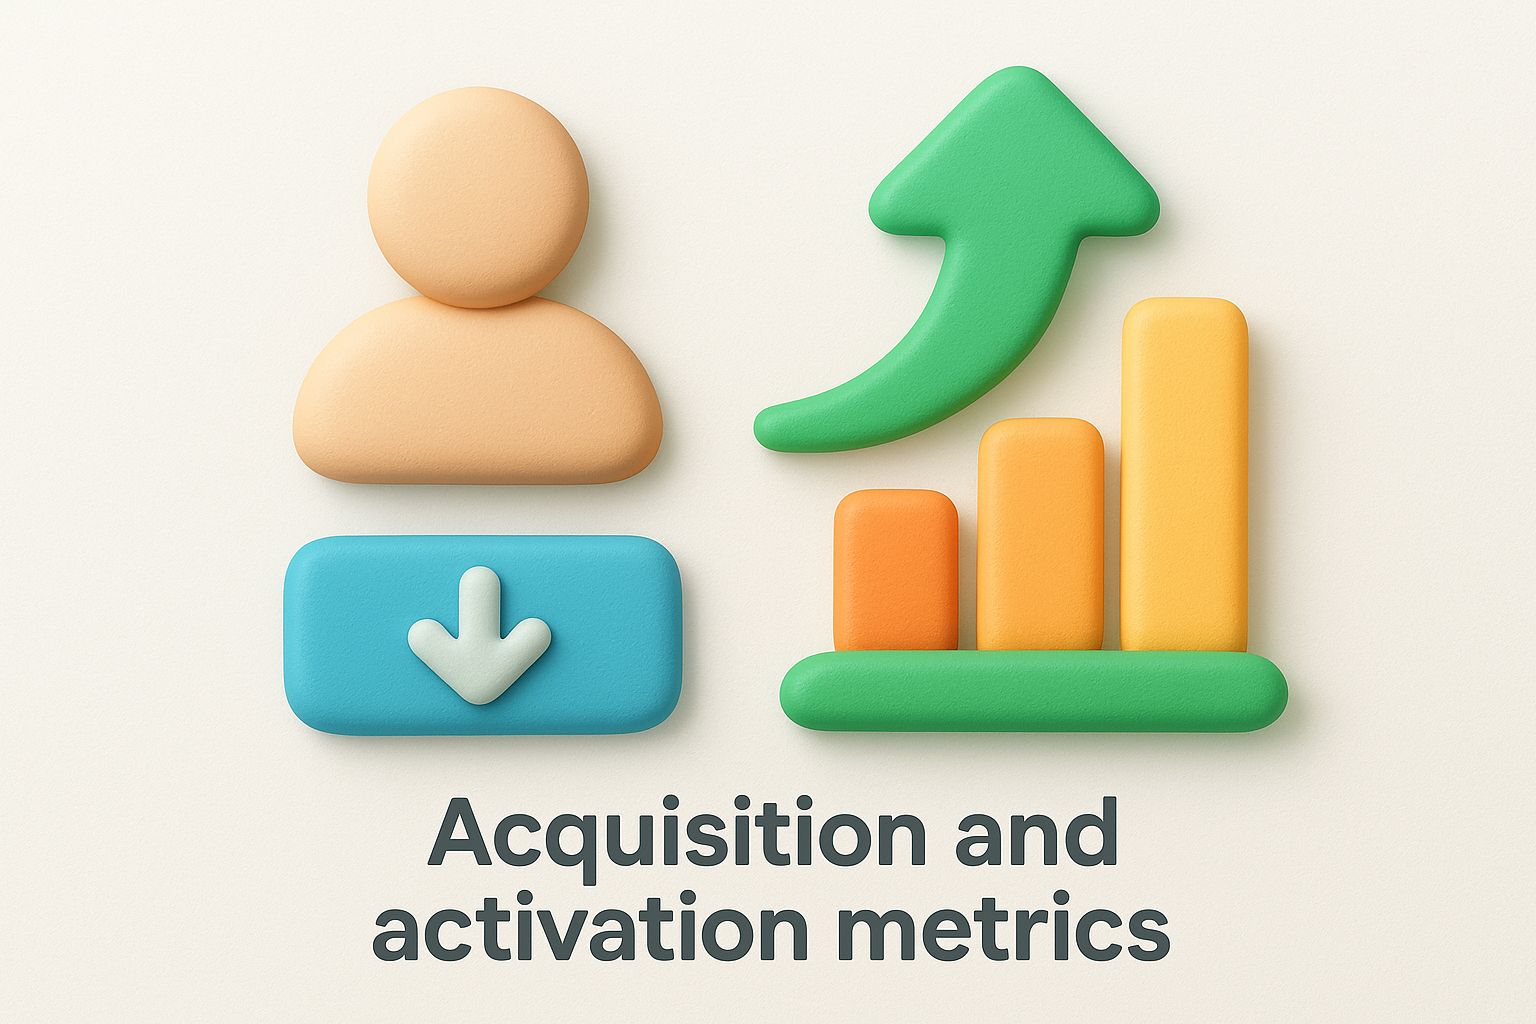
Acquisition metrics track how effectively you attract new users to your product. These include metrics like signup rate, number of qualified leads, and cost per acquisition. Activation metrics measure the next critical step: whether new users experience value quickly enough to keep using your product. You track activation rate, time to first value, and completion of key onboarding steps. These metrics tell you if your marketing brings the right people and whether your product delivers on its promise fast enough to hook them.
Engagement metrics show how active users interact with your product once they've activated. You measure daily active users, feature usage frequency, and session duration to understand which parts of your product deliver the most value. Retention metrics reveal whether users come back over time, tracking retention rate, churn rate, and cohort behavior. Strong engagement typically predicts strong retention, making these two categories closely connected.
Track both engagement and retention together to understand not just what users do, but whether they keep coming back.
Revenue metrics connect user behavior to business outcomes, measuring monthly recurring revenue, average revenue per user, and customer lifetime value. These metrics answer whether your product strategy translates into sustainable business growth. Business metrics also include operational measures like net revenue retention and customer acquisition cost payback period.
Understanding what are product metrics means knowing which specific KPIs matter most for your product decisions. The following metrics represent the core measurements that successful product teams track consistently. Each KPI connects directly to user behavior and business outcomes, giving you clear signals about what's working and what needs attention. You'll see concrete examples showing how to calculate these metrics and what healthy benchmarks look like across different product types.
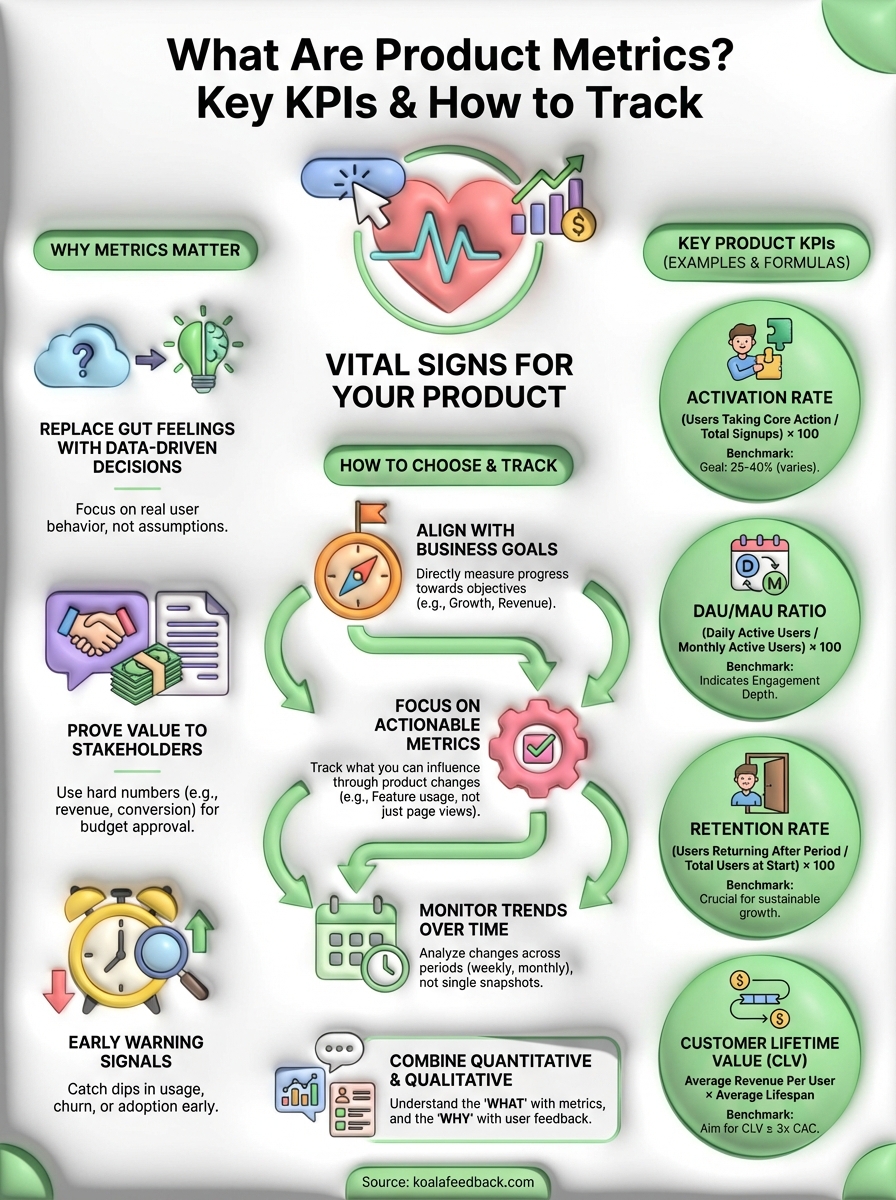
Activation rate measures the percentage of new users who complete your core value action within a specific timeframe. You calculate it by dividing the number of users who reached activation by the total number of signups, then multiply by 100. For a project management tool, activation might mean creating a first project and inviting a team member. If 350 out of 500 new signups this month completed both actions within seven days, your activation rate is 70%. Strong activation rates typically fall between 25% and 40%, though this varies widely by product complexity.
Track activation rate to understand how quickly new users discover why your product matters to them.
The DAU/MAU ratio shows what percentage of your monthly users return each day on average. You divide your daily active users by monthly active users and multiply by 100. If you have 15,000 daily active users and 100,000 monthly active users, your ratio is 15%. Social networks aim for 50% or higher, while B2B tools typically target 20% to 30%. This metric reveals user engagement depth and helps you understand if people use your product habitually or occasionally.
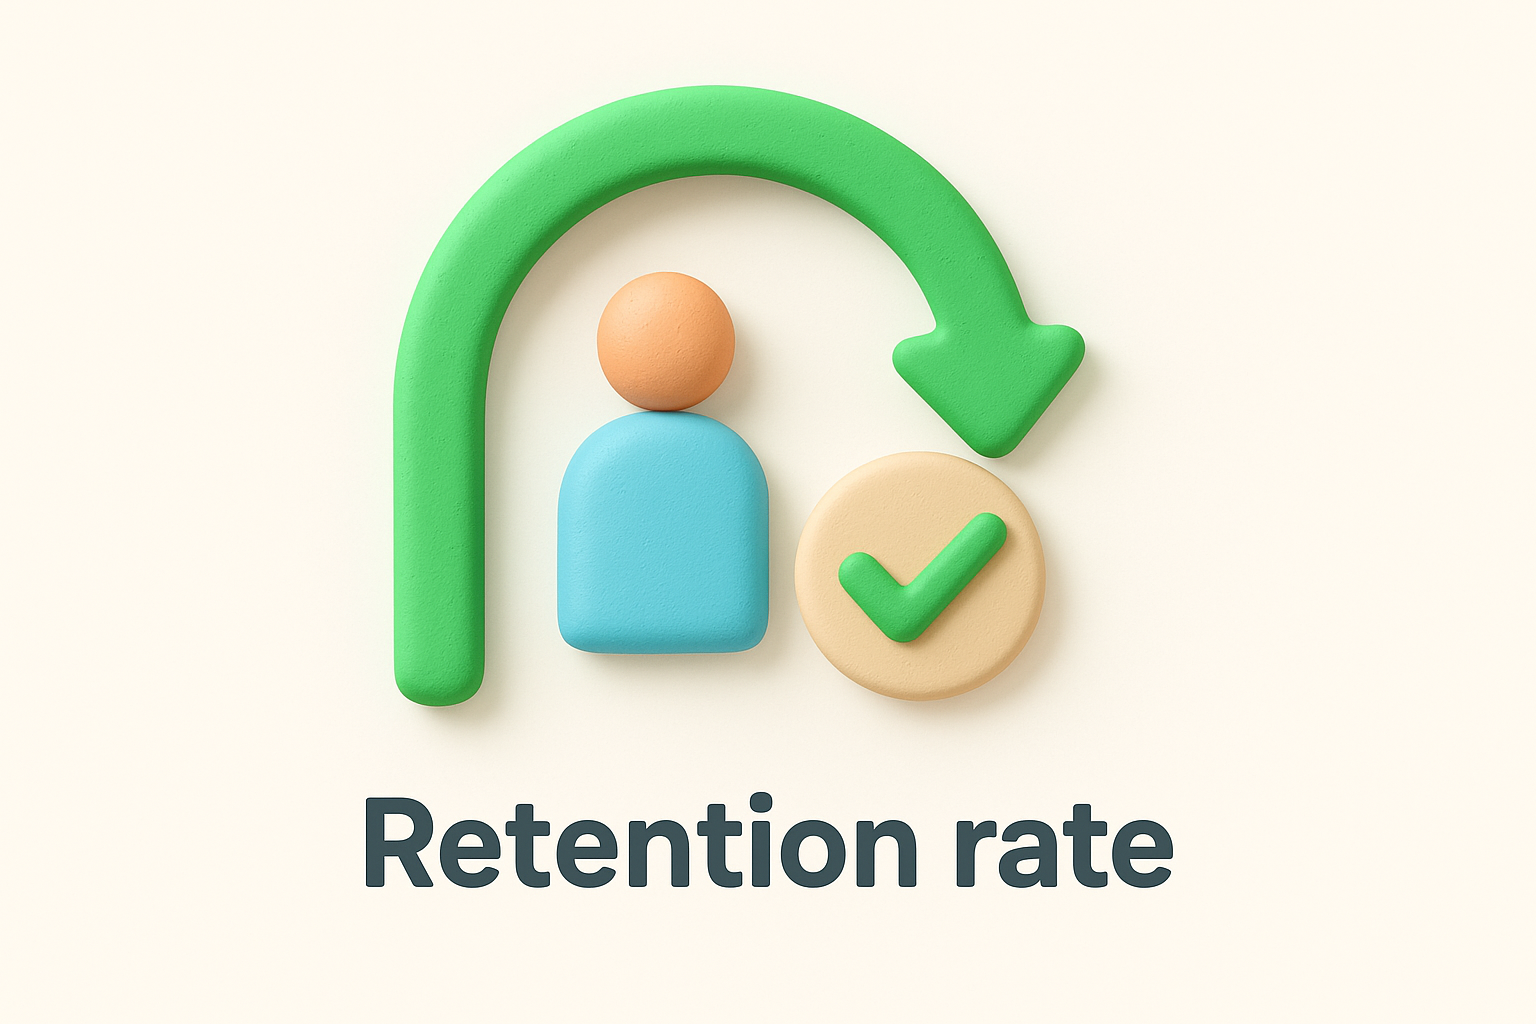
Retention rate tracks the percentage of users who return to your product after their first use. Calculate it by dividing the number of users who returned during a specific period by the total number who started that period. If 800 of 1,000 users from January are still active in March, your two-month retention rate is 80%. Most products see significant drop-off early, with 20% to 40% retention after 90 days considered solid for consumer apps. B2B products typically retain 70% to 90% because they solve critical business problems.
Customer lifetime value represents the total revenue a customer generates throughout their relationship with your product. You calculate it by multiplying average revenue per user by the average customer lifespan in months or years. If your average customer pays $50 monthly and stays for 24 months, their CLV is $1,200. Healthy businesses maintain a CLV that's at least three times higher than their customer acquisition cost. This metric tells you how much you can afford to spend acquiring customers while building a sustainable business model.
Tracking and analyzing what are product metrics requires the right approach and tools to capture meaningful insights from user behavior. You need systems that automatically collect data without requiring manual work for every event, and you need to review that data consistently to spot patterns and trends. The most effective teams build tracking into their product from day one, making metrics as fundamental to their workflow as code reviews or design critiques.
Your tracking setup starts with selecting a product analytics platform that captures user actions automatically. You want tools that let you define events, track user properties, and segment audiences without writing custom code for every metric. Most teams use platforms like Google Analytics for basic web tracking, though dedicated product analytics tools offer deeper insights into user journeys and feature adoption. The key is picking something your team will actually use consistently rather than the most feature-rich option.

Select analytics tools based on what you'll use daily, not what looks impressive in demos.
Analyzing metrics means looking at changes over time instead of single data points. A 5% drop in retention might signal a problem, or it might be normal weekly variation. You need to track metrics across multiple time periods to understand what's actually meaningful. Compare this week to last week, this month to last month, and this quarter to the same quarter last year. Watch for sudden changes that indicate problems and gradual trends that show whether your improvements work.
Understanding what are product metrics is only the first step. The real value comes from using these metrics to drive better product decisions and build features that solve real user problems. You need to review your metrics regularly, spot trends early, and act on the insights they reveal. When your data shows users struggling with a feature or abandoning your product at a specific step, you have clear direction on where to focus your efforts.
Closing the loop means combining quantitative metrics with qualitative feedback from your users. Numbers tell you what happens, but user feedback explains why it happens. Collect and organize user feedback to understand the story behind your metrics, prioritize the features that matter most, and keep users informed about the progress you're making. Your metrics become actionable when you pair them with direct input from the people using your product every day.

Start today and have your feedback portal up and running in minutes.
