You ship features every sprint. Users sign up daily. Revenue ticks up month over month. But are you measuring what actually predicts whether your product will succeed or stall? Most product teams drown in data while the metrics that matter get buried in dashboards nobody checks. You know you should track something beyond vanity metrics, but which numbers deserve your daily attention and which ones just make you look busy in stakeholder meetings?
This guide breaks down 15 essential product metrics every PM should track. You'll learn what each metric measures, how to calculate it with real formulas, and how to use the insights to make smarter product decisions. We'll cover everything from user feedback volume and your North Star metric through activation, retention, and revenue metrics. Each section includes practical examples, step by step calculation methods, and specific tips for tracking and improving the metric in your product.
Tracking how much feedback you collect and what users request tells you whether your product solves real problems or misses the mark. Feedback volume shows engagement levels while request patterns reveal gaps between what you built and what users actually need. This metric sits at the foundation of user driven product development and helps you spot product market fit issues before they tank your retention numbers.
High feedback volume signals that users care enough to speak up, but the content of that feedback determines whether you have product market fit. When most requests ask for variations of existing features, you likely hit the right problem. Requests for completely different functionality suggest you built for the wrong user or missed the core job to be done.
You should tag every piece of feedback with at least three dimensions: feature area, user segment, and request type. Feature area groups feedback by product section. User segment tracks who asked for what. Request type separates bugs from enhancements from entirely new capabilities. This structure lets you filter and prioritize based on multiple factors instead of gut feeling alone.
A project management tool received 147 requests for better mobile support and only 12 for advanced reporting. The team initially planned to build reporting because enterprise customers mentioned it in sales calls. Volume data shifted the roadmap to mobile first, which increased daily active users by 34% within two months of launch.
Koala Feedback automatically captures and categorizes user requests through your feedback portal. Users submit ideas, vote on existing requests, and comment on priorities. You get real time dashboards that show trending requests and segment feedback by user type without manual tagging or spreadsheet gymnastics.
Never count the loudest voices as the majority or confuse request frequency with strategic importance. Enterprise customers who pay ten times more deserve heavier consideration than free users flooding your inbox. Also avoid analysis paralysis by setting a threshold. If fewer than five users request something, park it until the pattern strengthens.
Track what users ask for, but weight those requests by the revenue and retention impact of the segment making them.
Your North Star Metric anchors every product decision to one number that captures the value your product delivers. This single metric connects user behavior to business growth and gives your entire team a shared definition of success. Unlike vanity metrics that look good in reports but predict nothing, a strong North Star correlates directly with retention and revenue while reflecting genuine user value.
The North Star Metric represents the single best indicator that your product creates value for users and captures value for your business. When this number goes up, everything else follows. You should track other key product metrics, but your North Star gives you one clear answer to whether you're moving in the right direction or spinning your wheels.
Pick a metric that users directly control through product usage and that predicts long term retention. Your North Star should increase when you improve the product and decrease when you make mistakes. Test potential candidates by looking at historical data to see which metric correlates strongest with accounts that stick around and pay more over time.
Spotify tracks time listening, Slack measures messages sent by teams, and Airbnb counts nights booked. SaaS products often use active projects created or reports generated depending on core value. E-commerce platforms typically choose purchases per month, while collaboration tools pick collaborative actions taken as their guiding star.
Your North Star sits at the top while input metrics show what drives it up or down. For a messaging app with "messages sent" as the North Star, supporting metrics include new user signups, activation rate, daily active users, and features used per session. Map these inputs to understand which levers move your star most efficiently.

The North Star bridges strategy and execution in frameworks like AARRR and HEART. It typically lives in the retention or engagement layer because sustainable growth requires users who keep coming back. Your North Star focuses roadmap discussions and helps you kill features that boost vanity metrics but don't move the needle on real value.
Choose a North Star that users control through product usage and that predicts whether they'll stick around and pay more over time.
Customer acquisition cost tells you exactly how much money you spend to turn a stranger into a paying customer. This metric directly impacts your unit economics and determines whether your business model actually works or just looks good in pitch decks. Every product team should track CAC alongside other key product metrics because spending more to acquire customers than they'll ever pay you is a fast track to burning through runway.
CAC captures the total investment required to acquire one new customer. This includes every dollar spent on marketing campaigns, sales team salaries, advertising costs, software tools, agencies, and any other expense tied to customer acquisition. You divide all those costs by the number of new customers acquired in the same period to get your per customer cost.
Calculate CAC by dividing your total sales and marketing expenses by the number of new customers acquired in that period. CAC = Total Sales and Marketing Costs / Number of New Customers. Pull cost data from your accounting system and customer count from your CRM or product analytics. Make sure you match the time periods exactly to avoid skewed results.
A SaaS company spent $50,000 on marketing and sales in March and acquired 200 new customers. Their CAC equals $250 per customer. If their average customer pays $30 per month and stays for 24 months, they generate $720 in lifetime value, which means they'll recover acquisition costs and turn profitable.
Focus your budget on channels that already work instead of spreading spend across every platform. Referral programs and product led growth reduce CAC because existing users do the selling for you. Improve your conversion rates at every funnel stage to get more customers from the same traffic and spend.
Teams often exclude overhead costs like sales operations or marketing tools, which artificially deflates CAC. Another mistake is using new signups instead of paying customers in your denominator, which makes your acquisition cost look lower than it actually is.
Calculate CAC using only paying customers in your denominator, not free signups or trial users who might never convert.
Customer lifetime value measures the total revenue you can expect from a single customer over their entire relationship with your product. This metric sits at the heart of sustainable growth because it tells you how much you can afford to spend on acquisition while staying profitable. When you track LTV alongside other key product metrics like CAC, you get a complete picture of whether your unit economics actually work or just look good on paper.
LTV reveals the long term value of your customer base and whether your business model creates sustainable growth. You use this metric to determine acquisition budgets, guide pricing decisions, and identify which customer segments deserve the most attention. Higher LTV customers justify higher acquisition costs and premium support experiences that would lose money on lower value segments.
Calculate basic LTV by multiplying average revenue per user by average customer lifetime in months or years. LTV = ARPU × Average Customer Lifetime. The advanced formula accounts for margins and churn by dividing ARPU by your churn rate, then multiplying by gross margin percentage. This gives you net LTV that reflects actual profit, not just revenue.
A subscription product charges $50 monthly with 5% monthly churn and 80% gross margins. Their LTV equals $50 divided by 0.05, multiplied by 0.80, which gives $800 per customer. With a CAC of $200, they recover acquisition costs in four months and run profitably for the remaining customer lifetime.
Aim for an LTV to CAC ratio of 3:1 or higher to ensure healthy margins and growth runway. Ratios below 3:1 signal you're spending too much on acquisition or charging too little. Ratios above 5:1 suggest you're underinvesting in growth and leaving market share on the table for competitors who spend more aggressively.
Break LTV down by acquisition channel, customer segment, product tier, and geography to spot patterns. Enterprise customers typically deliver 5 to 10 times higher LTV than self serve users but require different acquisition motions and support levels. Use these segments to allocate marketing budget and prioritize product features for segments with the strongest economics.
Calculate LTV by segment to identify which customer types justify premium acquisition spending and dedicated product investment.
Activation rate measures the percentage of new users who experience your product's core value within a specific timeframe. This metric bridges the gap between user acquisition and meaningful engagement, showing how well your onboarding process converts signups into active users who understand why your product matters. Strong activation rates predict higher retention and lower churn because users who reach the activation milestone stick around longer than those who never discover your product's value.
Activation represents the moment a user completes an action that demonstrates they understand and receive value from your product. For Slack, activation happens when a team sends 2,000 messages. For Dropbox, it occurs when users put files in one folder on one device. Your activation event should reflect the specific behavior that correlates strongest with users who become long term customers versus those who abandon your product after the first session.
Choose an activation event that users can complete in their first session or within the first week maximum. The event should require enough engagement to signal genuine interest but remain simple enough that motivated users can reach it quickly. Test multiple candidate events by tracking which ones predict retention at 30, 60, and 90 days to validate your choice with actual data instead of assumptions.
Calculate activation rate by dividing activated users by total new signups in the same period. Activation Rate = Activated Users / Total New Users. Track this metric by cohort to see how changes to your onboarding flow affect activation. Build your funnel to show each step from signup through activation so you can identify exactly where users drop off and need help.
A project management tool defined activation as creating a first project and inviting at least one team member. Their overall activation rate sat at 32%. Breaking this down by signup source revealed that users from product hunt activated at 18% while users from referrals hit 51%. This data shifted their acquisition strategy toward referral programs that brought pre qualified users who understood the product's value before signing up.
Reduce steps between signup and your activation event by removing unnecessary form fields and optional features. Send targeted emails and in app messages that guide users toward the activation milestone based on where they stall in your funnel. Offer interactive walkthroughs or checklists that break the activation event into smaller achievable steps instead of overwhelming new users with your entire feature set at once.
Track activation by acquisition channel to identify which sources bring users who reach your core value event fastest and stick around longest.
Time to first value measures how quickly new users experience the core benefit your product promises. This metric directly predicts whether users will stick around or abandon your product during those critical first sessions. When you reduce the time between signup and value delivery, you increase activation rates and build the foundation for long term retention.
Users decide whether your product deserves their attention within minutes of their first interaction. Every extra step or delay between signup and experiencing real value increases the likelihood they'll close the tab and never return. Products that deliver value quickly convert skeptical new users into engaged customers who want to explore more features and stick around long enough to form habits.
Different user segments experience value at different moments based on their use case and goals. A freelancer using your project management tool finds value when they create their first task, while a team lead experiences value when they invite team members and see collaboration happen. Survey your most engaged users to identify which early actions correlate strongest with continued usage and retention.
Calculate time to first value by measuring the duration between account creation and the moment users complete your activation event. Track the median time rather than average to avoid skew from outliers. A design tool with a median TTFV of 8 minutes means half of activated users reach value in under 8 minutes.
Remove optional steps from your onboarding flow and postpone advanced features until after users experience core value. Pre-populate accounts with sample data so users can interact with your product immediately instead of starting from a blank slate. Guide users toward the activation event with progressive disclosure that reveals features only when users need them.
Track TTFV by acquisition source, user role, and company size to identify which segments reach value fastest. Compare cohorts week over week to measure whether your onboarding improvements actually reduce time to value or just shuffle steps around without meaningful impact.
Monitor time to first value by user segment to build onboarding experiences that match how different types of customers discover and experience your product's core benefit.
Conversion rate tracks the percentage of users who complete a specific action you want them to take at any point in your product journey. This metric reveals how effectively each step in your funnel moves users toward meaningful outcomes like signups, trial starts, or purchases. Unlike other key product metrics that measure aggregate behavior, conversion rate lets you pinpoint exactly where users drop off and where small improvements create outsized impact.
You should track conversion at every critical transition point where users must take action to move forward. Common stages include landing page to signup, signup to activation, free to paid, and basic to premium tiers. Each stage reveals different friction points and optimization opportunities that affect your overall business performance.
Calculate conversion rate by dividing the number of users who complete the target action by the total number who entered that stage. Conversion Rate = Users Who Converted / Total Users at Stage Start. Track this formula separately for each funnel stage because a 50% conversion from trial to paid matters more than a 50% conversion from visitor to signup.
A SaaS product tracked 10,000 visitors who hit their homepage. 2,000 signed up (20% conversion), 1,200 activated (60% of signups), and 300 converted to paid (25% of activated users). The biggest opportunity sat in the homepage to signup conversion, where improving from 20% to 25% would add 500 more signups without spending extra on acquisition.
Test your call to action copy and button placement first because these changes ship fast and often deliver 10 to 30% lifts. Reduce form fields to absolute minimums, add social proof near conversion points, and create urgency without artificial scarcity that damages trust.
Multiply your conversion rate improvement by the value per conversion to calculate revenue impact. A 5% lift in free to paid conversion on 1,000 monthly trials at $50 per month equals $2,500 in new monthly recurring revenue or $30,000 annually.
Track conversion rates at every funnel stage to identify which optimizations deliver the highest return on your product development time.
Active user metrics count how many unique users engage with your product within specific timeframes. These measurements track daily active users (DAU), weekly active users (WAU), and monthly active users (MAU) to reveal engagement patterns and growth trends. You combine these numbers with other key product metrics to understand whether your user base grows steadily or churns faster than you acquire new users.
DAU counts unique users who perform at least one meaningful action in your product during a 24-hour period. WAU tracks users who engage at least once in a rolling seven-day window, while MAU measures unique users across a 30-day period. Each timeframe reveals different patterns, with DAU showing immediate engagement, WAU capturing weekly habits, and MAU reflecting overall reach.
Define activity based on actions that signal genuine product usage rather than passive behaviors like receiving emails or visiting your homepage. For a messaging app, activity means sending a message. For analytics software, it means viewing a report or dashboard. Your activity definition should match the core value users get from your product.
A collaboration tool tracked 50,000 MAU with 15,000 WAU and 8,000 DAU. The DAU to WAU ratio of 53% suggested users engaged multiple times weekly. Growth in MAU without corresponding DAU increases signaled users signed up but didn't form daily habits, pointing to onboarding issues that needed fixes.
You track active users through event-based analytics that log specific user actions with timestamps and user IDs. Most product analytics platforms automatically deduplicate users across sessions to give you accurate unique counts.
Break active user counts by acquisition source, user role, pricing tier, and feature usage to identify which segments drive growth. Enterprise users might log in weekly while individual users engage daily, requiring different engagement strategies for each group.
Segment your active users by behavior patterns and account characteristics to build targeted retention strategies that match how different user types interact with your product.
Product stickiness ratio measures how often your monthly users return to engage with your product. This metric divides daily active users by monthly active users to reveal whether you built something users want occasionally or something they need every day. Strong stickiness predicts sustainable growth because products that become daily habits generate more revenue per user and churn far less than tools users remember only when they receive email reminders.
Stickiness shows whether your product solves a frequent problem or addresses occasional needs. High stickiness means users integrate your product into their daily workflows and depend on it to accomplish important tasks. Low stickiness suggests users find your product helpful but not essential, which makes them vulnerable to competitors who deliver similar value with better execution.
Calculate stickiness by dividing your daily active users by monthly active users. Stickiness = DAU / MAU. A product with 5,000 DAU and 25,000 MAU has 20% stickiness, meaning the average monthly user engages on six days per month.
Social networks target 60 to 80% stickiness because users check them multiple times daily. Productivity tools aim for 30 to 50% as knowledge workers use them throughout their workweek. Financial planning software accepts 10 to 20% because users need it monthly rather than daily.
Prioritize features that increase usage frequency rather than breadth when stickiness falls below category benchmarks. Build notification systems, collaborative features, and automated workflows that give users reasons to return daily instead of adding more tools they use once and forget.
Create habit loops that trigger users to return without thinking. Send relevant notifications when teammates take actions that require responses. Build streak features that reward consecutive days of use. Add collaborative elements that pull users back when others engage with their work.
Track stickiness by user segment to identify which customer types form daily habits and which ones need stronger engagement triggers to increase frequency.
Feature adoption rate measures the percentage of your active users who actually use a specific feature you built. This metric reveals whether your development effort translates into user behavior changes and helps you separate features that deliver value from ones that waste engineering time. You track adoption alongside other key product metrics to determine which capabilities deserve continued investment and which ones should be deprecated or redesigned.
Adoption rate shows how many of your active user base engage with a particular feature within a defined timeframe. This metric answers whether users discover, understand, and find value in the functionality you shipped. Low adoption signals problems with feature visibility, complexity, or relevance to user needs.
Calculate feature adoption by dividing the number of users who engaged with the feature by your total active users in the same period. Feature Adoption Rate = Users Who Used Feature / Total Active Users. Track this monthly for new features and quarterly for established ones to spot trends early.
A collaboration platform shipped advanced search filters that achieved only 3% adoption after six months. Meanwhile, their basic commenting feature hit 67% adoption within two weeks of launch. They deprecated the search filters and invested engineering time into expanding commenting capabilities, which increased daily active usage by 18%.
Surface important features through in-app prompts that trigger when users encounter problems those features solve. Add onboarding tooltips that explain value rather than just describing functionality. Send targeted emails to segments who would benefit most from underused capabilities.
Compare what users request against what they actually use when you build it. Features with high request volume but low adoption reveal gaps between perceived and actual value. This comparison helps you validate future requests before committing engineering resources.
Monitor feature adoption by user segment to identify whether your target power users adopt capabilities faster than casual users who might never need advanced functionality.
Retention rate measures the percentage of users who return to your product after their first visit or within a specific time window. This metric tells you whether you built something users want to use repeatedly or just checked out once and forgot. High retention rates signal product market fit and sustainable growth because keeping existing users costs far less than acquiring new ones to replace those who disappear.
You should define retention based on actions that signal genuine value extraction rather than passive presence. Classical retention tracks whether users perform any activity in a period. Bracket retention measures users who return on specific days like day 1, 7, or 30. Range retention counts users who come back at least once during a window. Unbounded retention tracks cumulative users who ever returned after day zero, showing long term engagement patterns.
Calculate retention by dividing the number of users who returned by the total cohort size who started in the same period. Retention Rate = Users Who Returned / Total Users in Cohort. Track retention curves by cohort to compare how users acquired in different months perform over time. Break cohorts by acquisition channel, product tier, and user segment to identify which groups stick around longest.
A mobile app tracked 1,000 users who signed up in January. Day 1 retention sat at 40%, day 7 dropped to 22%, and day 30 leveled at 15%. The curve flattened after day 30, suggesting users who survived the first month formed lasting habits. This pattern helped the team focus retention improvements on the critical first week.
Build features that create network effects where value increases as more teammates join and contribute. Send behavior triggered emails that bring users back when relevant events occur. Add progress indicators that show users how far they've come and what they'll lose by leaving.
Retention determines your customer lifetime value because users who stick around longer generate more revenue per acquisition dollar spent. You calculate sustainable growth by multiplying retention rate by your acquisition numbers to see whether your user base expands or slowly bleeds out.
Track retention by cohort and acquisition channel to identify which user sources deliver customers who stick around and generate the highest lifetime value.
Churn rate measures the percentage of customers who stop using your product during a specific period. This metric reveals whether you're losing customers faster than you acquire them and directly impacts your growth trajectory and profitability. While acquisition metrics tell you how fast water flows into your bucket, churn shows you the size of the holes draining it out.
You should track both customer churn and revenue churn because they tell different stories about your business health. Customer churn counts the number of accounts that cancel while revenue churn measures the dollar value lost from those cancellations. You also want to monitor logo churn for enterprise products and seat churn for products with team based pricing.
Calculate customer churn by dividing lost customers by total customers at period start. Customer Churn Rate = Customers Lost / Total Customers at Start. Revenue churn follows the same pattern using revenue instead of accounts. Revenue Churn = Revenue Lost / Total Revenue at Start. Track these monthly for subscription products and quarterly for annual contracts.
A productivity tool showed 8% overall monthly churn but segment analysis revealed teams under five users churned at 14% while teams over 20 users churned at only 3%. This insight shifted their strategy toward acquiring larger teams and building features that scaled with team size to reduce early stage churn.
Send targeted outreach when users show disengagement signals like reduced login frequency or feature usage drops. Offer personalized help, discount incentives, or feature recommendations based on their usage patterns. Build win back campaigns for recently churned users with updated features that address their original cancellation reasons.
Compare feedback from churned users against retained customers to identify specific pain points that drive cancellations. Users who submit feedback before churning often signal problems you can fix before losing similar customers in the future.
Track churn by customer segment and acquisition source to identify which user types leave fastest and build targeted retention strategies that address their specific needs.
Monthly recurring revenue (MRR) and annual recurring revenue (ARR) track the predictable income your subscription product generates each period. These metrics sit at the core of SaaS financial planning because they measure sustainable growth independent of one-time payments or usage spikes. You use MRR and ARR alongside other key product metrics to forecast revenue, plan hiring, and demonstrate business health to investors who care more about recurring income than total bookings.
Recurring revenue reflects the health of your subscription base and predicts future cash flow with far more accuracy than revenue from one-time purchases. You can plan product development roadmaps and scale operations confidently when you know how much guaranteed income arrives each month. This metric also reveals growth trends that total revenue masks, like whether expansion from existing customers offsets losses from churn.
Calculate MRR by summing all monthly subscription fees from active customers at the end of the period. For annual contracts, divide the contract value by 12 and add it to your monthly total. ARR = MRR × 12 for pure subscription businesses. Exclude one-time setup fees, professional services, and usage based charges that vary month to month.
A product started January with $100,000 MRR. They added $15,000 from new customers, gained $8,000 from existing customer expansions, and lost $5,000 to churn. February MRR landed at $118,000, showing 18% monthly growth driven more by new acquisition than expansion or retention improvements.
You forecast hiring needs, infrastructure costs, and development budgets based on projected MRR growth rather than hoping for sales spikes. Track your MRR growth rate to set realistic targets and identify when growth slows before it impacts your cash position.
Never count annual contracts as 12 times MRR because that double counts revenue and inflates your numbers. Avoid including non-recurring revenue like implementation fees or overage charges that won't repeat next month.
Track MRR by cohort and expansion source to understand whether growth comes from new customer acquisition or existing customer success and expansion.
Average revenue per user (ARPU) measures how much revenue your business generates from each customer during a specific period. This metric reveals the financial efficiency of your user base and helps you understand whether growth comes from adding more customers or extracting more value from existing ones. You track ARPU alongside other key product metrics to identify pricing opportunities and segment your customers by value contribution.
ARPU shows whether your monetization strategy works effectively across your user base. Rising ARPU signals that customers find increasing value in your product and willingly pay more through upgrades or expanded usage. Declining ARPU suggests you're acquiring lower value customers or failing to convert users to higher tier plans.
Calculate ARPU by dividing your total revenue by the number of active users in that period. ARPU = Total Revenue / Number of Active Users. Break this metric down by customer segment, acquisition channel, pricing tier, and geography to spot patterns. Enterprise customers typically deliver 10 to 50 times higher ARPU than self-serve users.
A collaboration tool generated $500,000 monthly revenue from 5,000 customers, producing $100 ARPU. With a CAC of $300, they recovered acquisition costs in three months. Segment analysis showed customers from referrals had $180 ARPU while paid ads delivered only $60 ARPU, shifting their growth strategy toward referral programs.
You increase ARPU by introducing premium tiers that serve power users willing to pay more for advanced capabilities. Usage based pricing lifts ARPU automatically as customers grow. Feature packaging that reserves high value tools for paid plans converts free users into revenue contributors.
Multiply ARPU by average customer lifetime to calculate lifetime value quickly. Track ARPU alongside net revenue retention to understand whether existing customers expand their spending or stay flat over time.
Monitor ARPU by acquisition source and customer segment to identify which channels bring users who pay more and stay longer.
Net Promoter Score (NPS) measures how likely your customers are to recommend your product to others. This metric captures customer loyalty and satisfaction through a single question that predicts whether users will become advocates who drive organic growth through referrals. You track NPS alongside other key product metrics to understand whether your product improvements translate into customers who love what you built enough to tell their friends and colleagues about it.
NPS quantifies the percentage of promoters minus the percentage of detractors in your user base. Promoters rate you 9 or 10 on a scale of 0 to 10, passives give 7 or 8, and detractors score you 0 through 6. This metric reveals whether your customer sentiment trends positive or negative and predicts organic growth potential better than satisfaction scores alone.
You should ask the NPS question after users complete meaningful interactions like finishing onboarding or using a major feature. Send surveys quarterly to track trends without overwhelming users with constant requests. Keep surveys short with just the rating question plus one optional open-ended follow-up asking why users gave that score.
Survey 100 users where 60 rate you 9 or 10 (promoters), 20 give 7 or 8 (passives), and 20 score 0 through 6 (detractors). NPS = 60% - 20% = 40, which sits in the good range for most SaaS products.
Contact detractors directly to understand their pain points and fix issues before they churn. Ask promoters for referrals, testimonials, or case studies while their enthusiasm runs high. Use the qualitative feedback to identify patterns across responses.
Track NPS changes after major releases to measure whether new features improve or damage customer satisfaction. Link NPS trends to retention and expansion rates to validate whether satisfied customers actually stick around and pay more over time.
Monitor NPS by customer segment to identify which user types love your product and which ones need targeted improvements to become promoters.
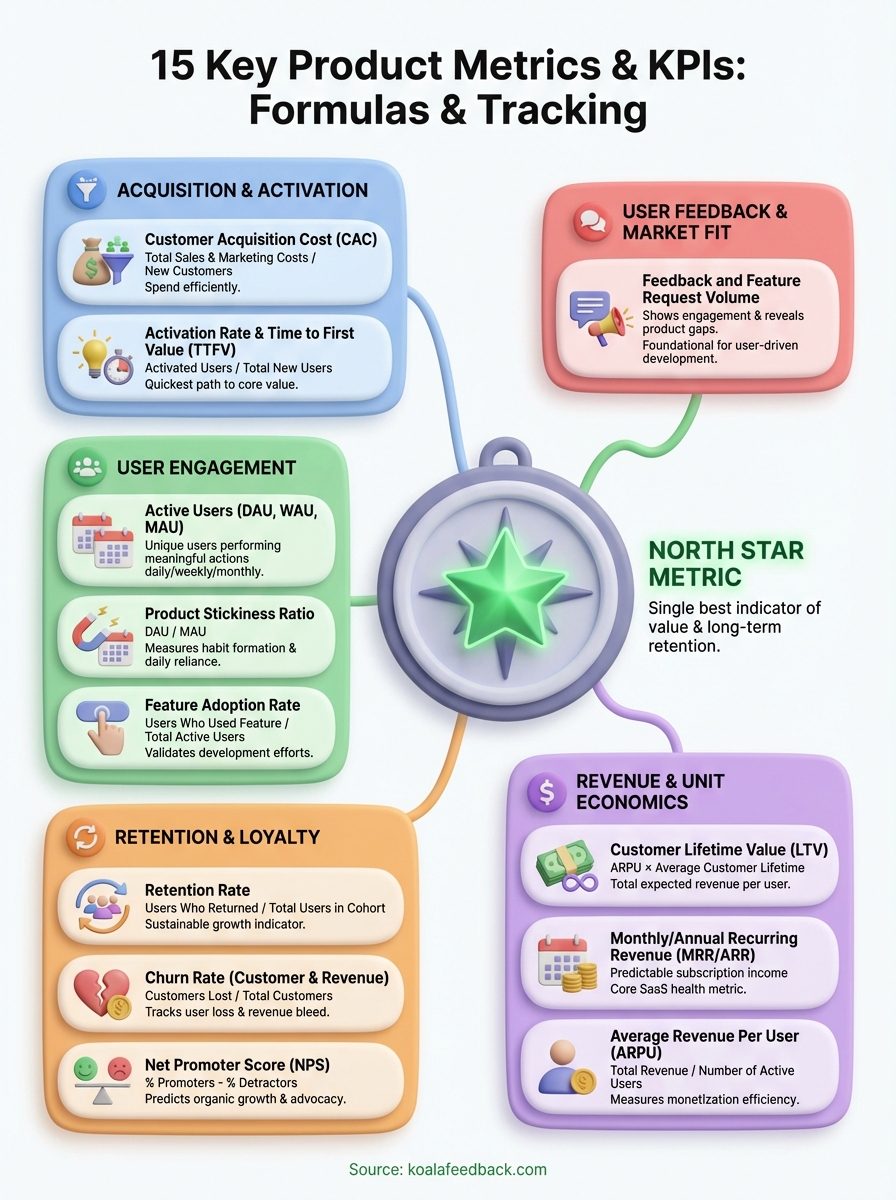
Tracking these key product metrics transforms gut feelings into decisions backed by real user behavior and revenue data. You now have formulas, benchmarks, and practical examples for measuring what actually predicts product success. The metrics that matter most depend on your growth stage and business model, but every product team should monitor at least one metric from each category: acquisition, activation, engagement, retention, and revenue.
Start by selecting three to five metrics that align with your current priorities rather than attempting to track everything at once. Focus your team's attention on moving the numbers that drive sustainable growth and customer satisfaction. When you collect feedback alongside these metrics, you get the complete picture of both what users do and why they do it. Track user feedback and feature requests with Koala Feedback to connect quantitative metrics with qualitative insights that inform smarter product decisions.

Start today and have your feedback portal up and running in minutes.
