You build features users request. You ship updates regularly. Yet revenue stays flat and churn keeps climbing. The disconnect happens because most teams measure the wrong things. They track feature adoption or usage stats without connecting those numbers to actual business value. Product value metrics solve this problem by revealing which activities genuinely drive ROI and which just create busywork.
The right value metric acts as your north star. It shows whether users extract real benefit from your product and whether that benefit translates into sustainable revenue growth. When you measure what truly matters, you stop guessing which features to prioritize and start making decisions backed by clear financial outcomes. Your team aligns around a single metric that reflects both user success and business performance.
This guide walks you through choosing value metrics that actually work. You'll learn how to align metrics with strategy, map them to user journeys, and validate whether they predict revenue. We'll cover practical examples from SaaS teams and show you how to instrument tracking without overwhelming your team. By the end, you'll have a framework for selecting metrics that drive real ROI instead of vanity numbers.
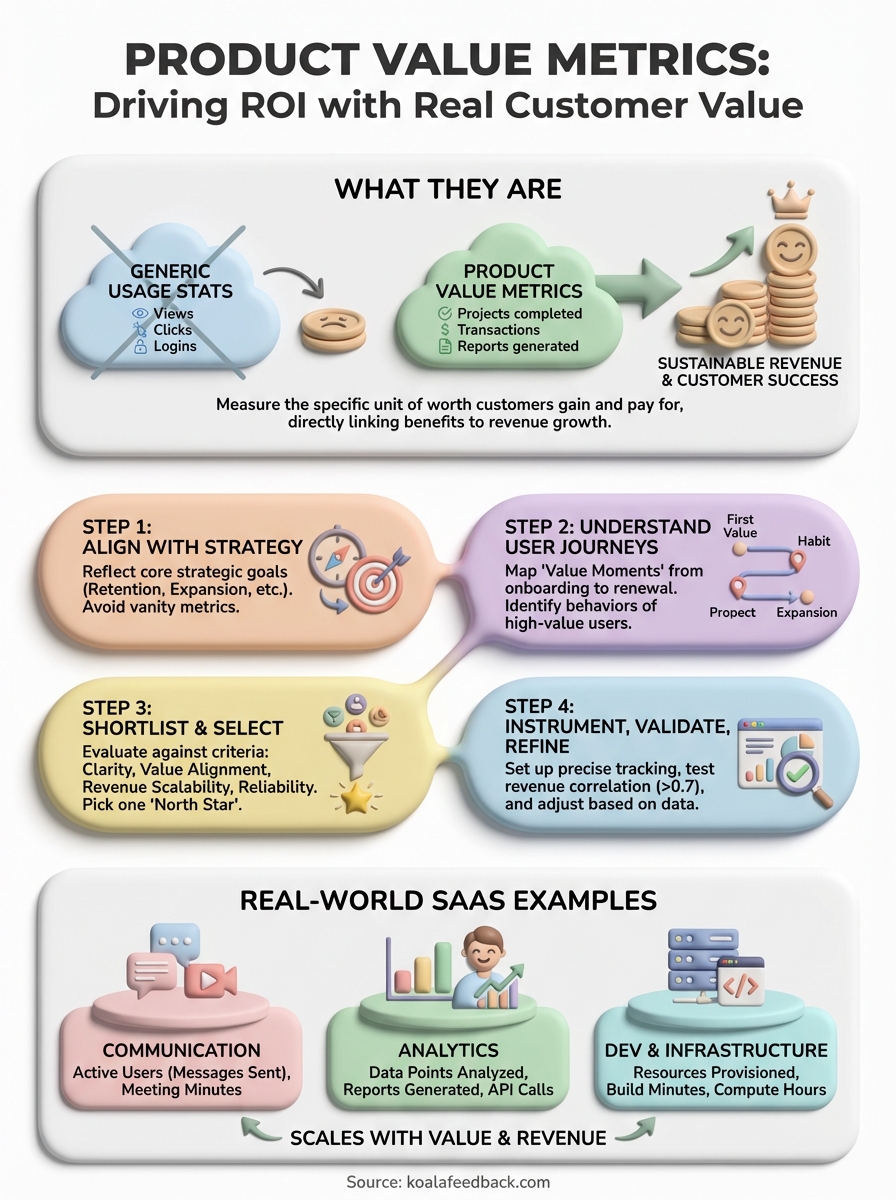
Product value metrics measure the specific unit of value your customers gain from using your product. Unlike generic usage stats, these metrics quantify the direct benefit users receive and tie that benefit to revenue growth. A value metric reflects what customers actually pay for, whether that's storage space used, transactions processed, or projects completed. You use this metric to set pricing, track product success, and predict which users will convert or expand.
Value metrics capture the exchange of worth between your product and your users. They answer a simple question: what increases as your customers get more value? For a project management tool, the metric might be active projects or team members collaborating. For an analytics platform, it could be data points analyzed or reports generated. The metric scales naturally with customer success because users who extract more value use more of the measured unit.
This scaling property makes value metrics fundamentally different from seat-based pricing or flat tiers. When customers grow their usage of your value metric, they signal deeper product adoption and willingness to pay more. Your revenue model aligns with customer outcomes instead of arbitrary feature gates.
Most teams confuse product value metrics with engagement metrics or vanity numbers. Daily active users tells you who shows up, but not whether they accomplish anything meaningful. Feature adoption rates track clicks, but not business outcomes. Value metrics connect usage patterns directly to revenue by measuring the core benefit your product delivers.
The right value metric grows proportionally with both customer success and your revenue, creating natural alignment between what users need and what your business earns.
Consider a video hosting platform. Views and uploads are engagement metrics. Storage consumed or bandwidth used represents the actual value exchange because these metrics reflect how much customers rely on the platform and scale with their willingness to pay. You track both types of metrics, but only value metrics inform pricing decisions and revenue forecasts.
Your value metric must reflect your core product strategy, not just what's easy to measure. Start by reviewing your strategic objectives for the next 12 months. If your strategy focuses on customer retention, choose a metric that correlates with long-term engagement like projects completed or workflows automated. If you prioritize expansion revenue, select a metric that scales naturally as customers grow, such as team members added or API calls consumed. The metric you pick should make your strategic priorities measurable and create clear accountability across teams.
List your top three strategic goals and identify the customer behavior that signals progress toward each goal. For retention, this might be daily logins or features used per session. For expansion, track usage thresholds where customers historically upgrade tiers. Create a simple mapping template:
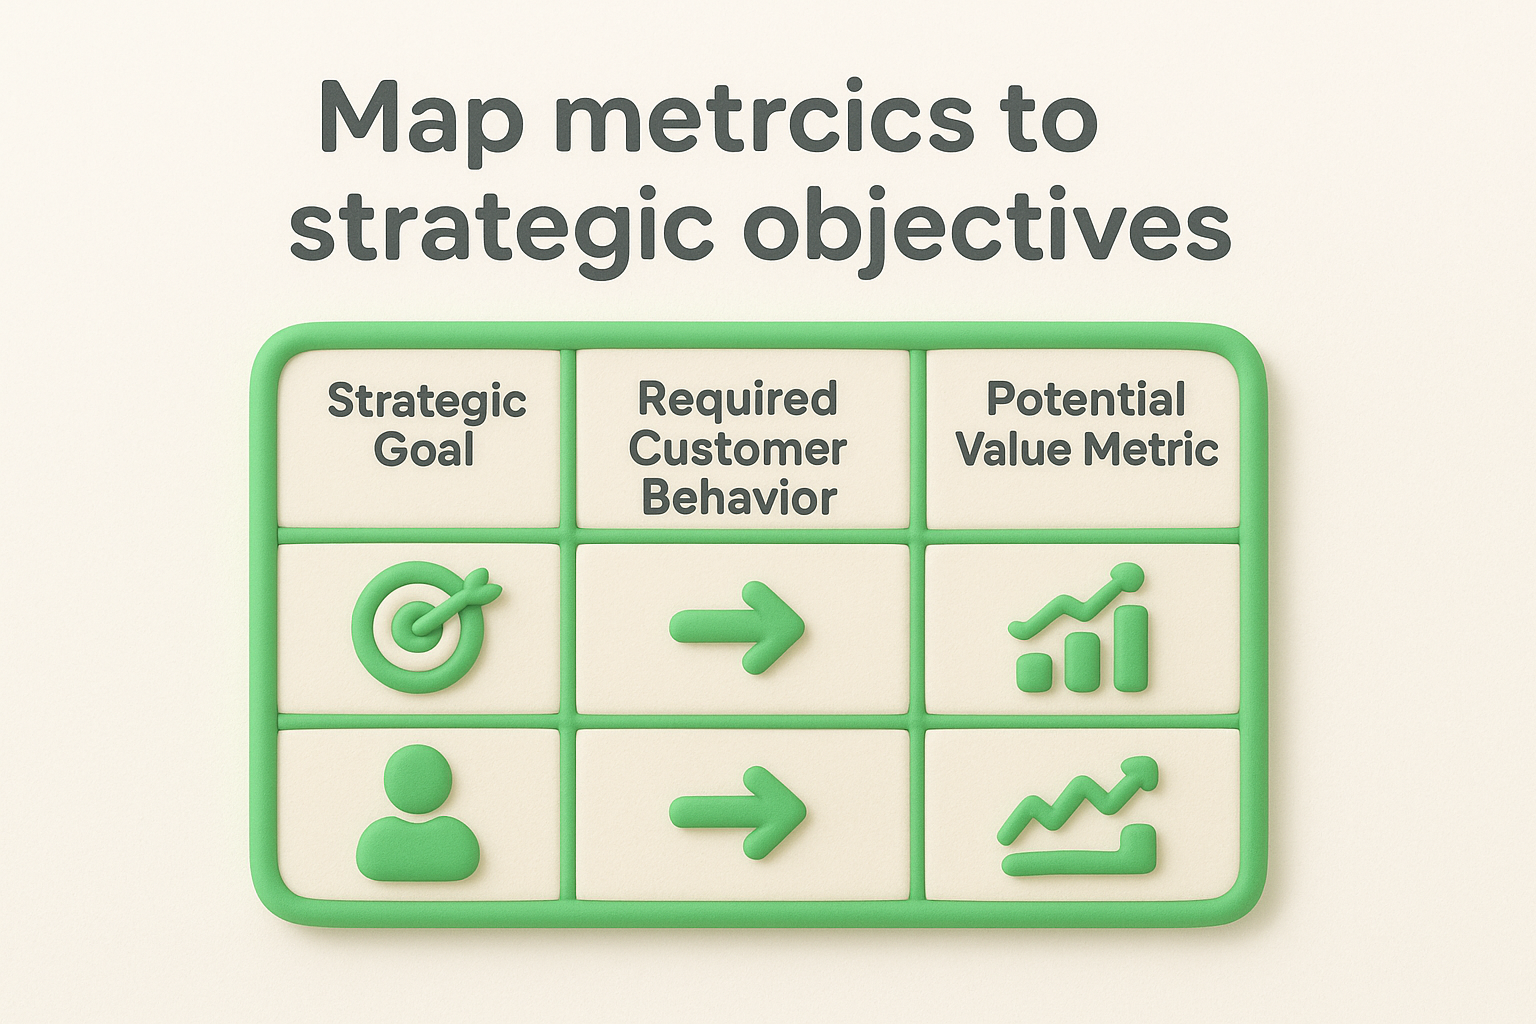
| Strategic Goal | Required Customer Behavior | Potential Value Metric |
|---|---|---|
| Reduce churn by 15% | Users complete onboarding workflows | Workflows completed per account |
| Grow ARPU by 25% | Teams add more members as they succeed | Active collaborators per workspace |
| Enter enterprise segment | Customers process higher transaction volumes | Transactions processed monthly |
This exercise forces you to connect abstract strategy to concrete usage patterns. You need metrics that move when customers extract more value and when your business achieves its targets. The strongest candidates appear in multiple rows because they support several strategic objectives simultaneously.
Teams default to seat-based metrics or feature counts because they're familiar, not because they align with strategy. If your goal is to democratize access to analytics across organizations, charging per user actively works against that objective. Users hesitate to invite teammates when each addition increases cost. Your metric should encourage behaviors that support strategic goals rather than create friction.
Pick a value metric that rewards customer success and naturally drives the business outcomes you need to achieve.
Consider two SaaS tools with identical retention goals. One charges per project and sees teams consolidate work to save money. The other charges based on data processed and watches usage grow as customers centralize their workflows. Only the second metric aligns with a retention strategy because higher usage strengthens product dependency. Your metric shapes customer behavior, so choose one that pushes users toward actions that benefit both them and your strategic objectives.
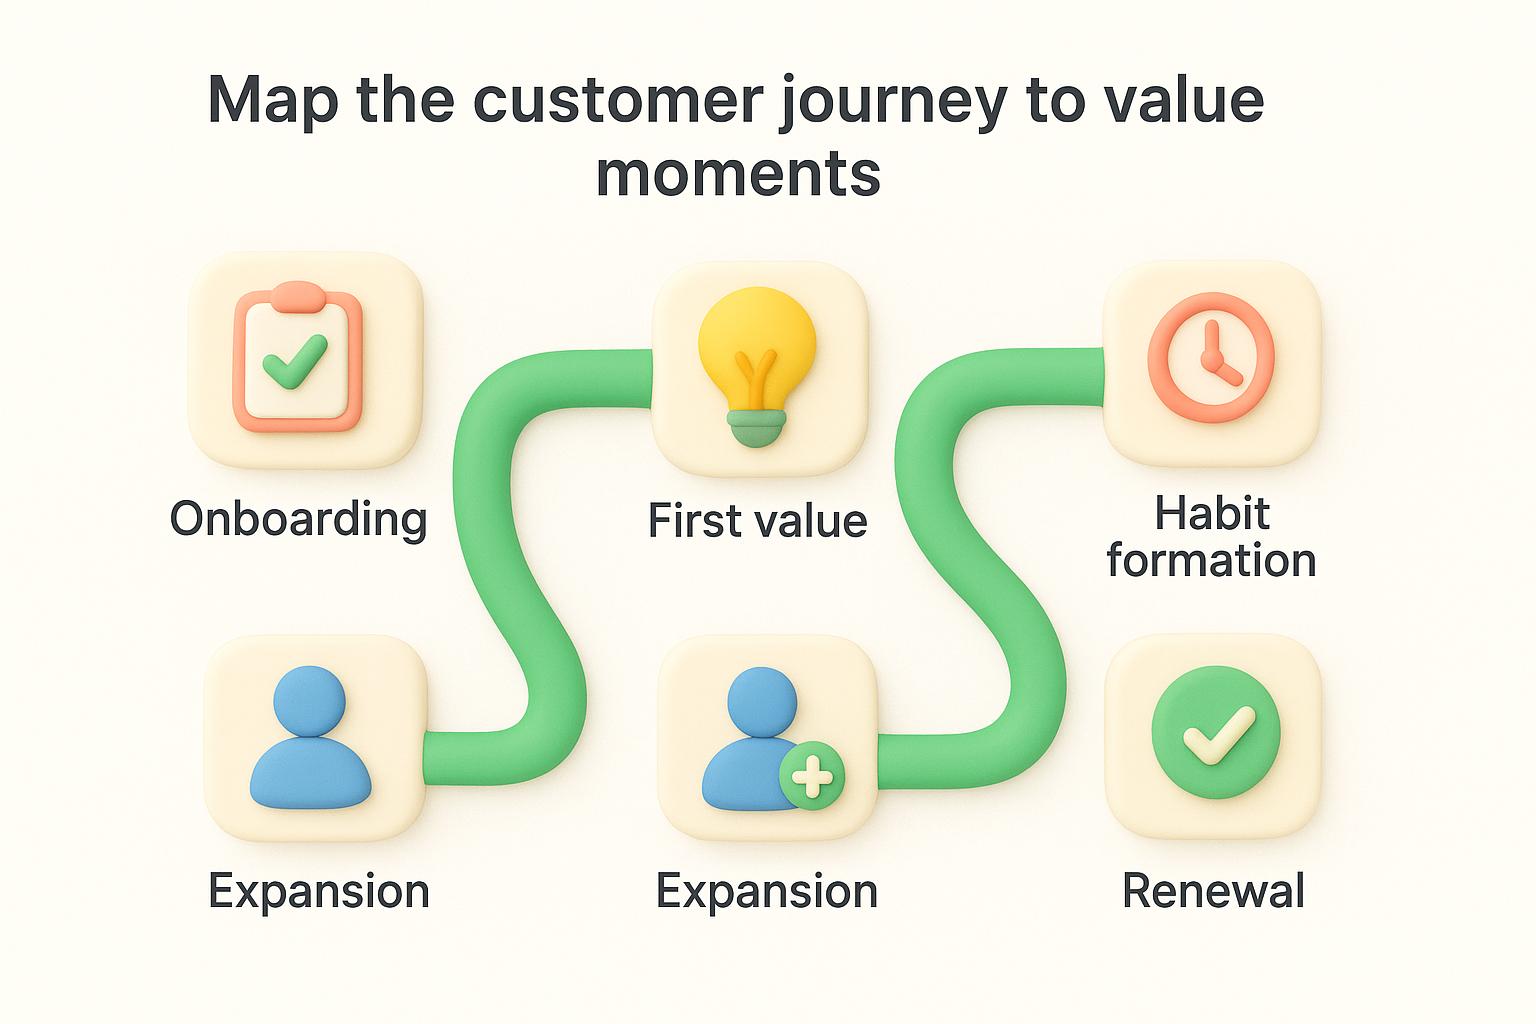
You cannot choose effective product value metrics without knowing how customers actually use your product and where they experience meaningful outcomes. Map the complete customer journey from signup through retention and expansion. Document each stage where users achieve a tangible result, such as completing their first workflow, inviting teammates, or automating a repetitive task. These value moments reveal what customers consider worth paying for and which behaviors predict long-term success.
Create a visual timeline showing every touchpoint from initial trial through renewal. Mark the specific actions that correlate with customer retention and expansion revenue. For each stage, identify the measurable event that signals value delivery:
| Journey Stage | Customer Action | Value Delivered | Measurable Event |
|---|---|---|---|
| Onboarding | Connects data source | Can analyze their data | Data source authenticated |
| First value | Generates first report | Sees actionable insights | Report created and viewed |
| Habit formation | Returns daily for week | Relies on product for decisions | 7-day active streak |
| Expansion | Adds team members | Collaboration improves outcomes | Additional users invited |
| Renewal | Processes high volume | Product becomes critical infrastructure | Monthly usage exceeds baseline |
This mapping exercise forces you to think from the customer perspective instead of your internal feature list. You identify which actions genuinely matter to users and which just create noise in your analytics. The strongest value metrics emerge from stages where customers demonstrate tangible progress toward their goals, not just platform engagement.
Segment your user base by revenue contribution and retention rate. Analyze the top 20% of customers who generate 80% of your revenue. What specific behaviors do these power users share? Track their usage patterns across your product and identify the common activities they perform significantly more than churned accounts. These patterns reveal which metrics correlate with customer success and willingness to pay premium prices.
Compare high-value customers against those who churned within 90 days. Calculate the difference in specific usage metrics between these groups. If power users process 10x more transactions than churned accounts, transaction volume becomes a strong candidate for your value metric. The wider the gap between successful and unsuccessful customers on a particular dimension, the more predictive that metric becomes.
When you find activities that separate your best customers from everyone else, you've identified behaviors worth measuring and encouraging.
Take the value moments from your journey map and the behavioral patterns from your best customers. Combine these insights to generate a shortlist of metrics that track progress through critical stages. Your value metric should increase as customers move from trial to power user status and correlate with both usage depth and revenue growth.
Test whether potential metrics align across all journey stages. A strong candidate metric grows predictably as customers advance from onboarding through expansion. Weak metrics spike during one stage but remain flat during others, making them useful for tactical decisions but poor choices for your primary value metric.
You now have potential value metrics from your journey mapping and customer analysis. The next step involves narrowing this list to one or two metrics that meet specific criteria and support sustainable pricing. Apply a structured evaluation framework to each candidate metric, testing whether it satisfies both customer value and business requirements. This disciplined approach prevents you from choosing metrics that feel intuitive but fail in practice when you build pricing tiers or track revenue impact.
Build a scoring rubric that evaluates each potential metric against five essential criteria. Rate each candidate on a scale of 1 to 5 for how well it meets these requirements:

| Criteria | What It Means | Example Question |
|---|---|---|
| Customer clarity | Users immediately understand what they're paying for | Can a new user explain this metric to their boss? |
| Value alignment | The metric grows as customer outcomes improve | Does higher usage mean the customer is more successful? |
| Revenue scalability | You can charge more as the metric increases | Would customers accept 2x pricing for 2x usage? |
| Tracking reliability | You can measure it accurately without edge cases | Can you count this metric consistently across all accounts? |
| Competitive context | Industry standards make it familiar or novel enough to differentiate | Do competitors use this or something similar? |
Calculate a total score for each metric by adding ratings across all criteria. Metrics scoring below 20 out of 25 points typically create problems later. You might love a clever metric that differentiates your product, but if customers cannot grasp how usage translates to cost, they will resist upgrading regardless of value delivered.
Take your top three scoring metrics and sketch actual pricing tiers using each one. Build a simple three-tier structure showing how customers would pay as usage grows. This exercise reveals whether the metric works in real pricing scenarios or creates awkward gaps and overlaps.
For each metric, answer these questions: Can you set tier boundaries that make sense to customers? Do natural upgrade points exist where customers would willingly pay more? Does the pricing create perverse incentives that discourage valuable behaviors? A storage-based metric fails if power users delete files to avoid upgrades instead of expanding their account. An API call metric fails if customers batch requests inefficiently just to stay within tier limits.
Your product value metrics should encourage customers to extract more value from your product, not game the system to minimize usage.
Compare how each metric performs across different customer segments. Enterprise customers might process thousands of transactions daily while small businesses handle dozens. Your metric needs sufficient range to accommodate both segments without creating absurd pricing disparities. If your smallest tier starts at 100 units monthly and enterprises need 1 million units, verify that the pricing curve between these extremes remains rational.
Choose the metric that scores highest in your framework and creates the cleanest pricing structure. You want a single primary value metric that drives decision-making across product development, marketing, and sales. Secondary metrics can inform tactics, but one metric must serve as your north star for measuring product success and aligning teams around customer outcomes.
Document your selection rationale in a brief memo explaining which criteria mattered most and how the chosen metric supports strategic objectives. This documentation prevents future debates when someone suggests changing metrics based on short-term trends. Your value metric should remain stable for at least 12 months, giving customers predictability and your team time to optimize around a consistent measurement of success.
Selecting your value metric represents just the beginning. You need reliable tracking systems that capture this metric accurately across every customer account and usage scenario. Build the technical infrastructure to measure your chosen metric consistently, then validate whether it actually predicts revenue outcomes as expected. This validation process often reveals gaps between theoretical metric selection and real-world performance, requiring iterative refinement before you can trust the metric to guide product decisions.
Implement event tracking that captures every instance of your value metric across all product touchpoints. If your metric is projects created, instrument tracking on the project creation endpoint, any bulk import features, and template instantiation flows. You need complete visibility into how and when customers generate units of your metric to avoid undercounting that creates billing disputes or revenue leakage.
Create a data validation layer that checks metric integrity during collection. Build automated tests that verify counts match expected patterns and flag anomalies for investigation. This validation prevents scenarios where edge cases, duplicate events, or partial implementations corrupt your metric data.
// Example event tracking for value metric
analytics.track('project_created', {
  user_id: currentUser.id,
  account_id: currentAccount.id,
  project_id: newProject.id,
  creation_method: 'manual', // or 'import', 'template'
  timestamp: Date.now()
});

// Aggregate and validate daily
SELECT account_id,
       COUNT(DISTINCT project_id) as project_count,
       DATE(timestamp) as date
FROM project_events
WHERE event_type = 'project_created'
GROUP BY account_id, DATE(timestamp);
Track your metric at multiple aggregation levels: individual user, account, and cohort. Account-level tracking supports billing and pricing decisions. User-level data reveals adoption patterns within teams. Cohort analysis shows how metric growth varies across customer segments and acquisition channels.
Pull three months of data comparing your product value metrics against actual revenue outcomes. Calculate the correlation coefficient between metric usage and account value for your entire customer base. Strong value metrics show correlation above 0.7, meaning customers who use more of the metric consistently generate higher revenue. Weak correlations below 0.5 suggest you picked the wrong metric or need additional factors.
Segment this analysis by customer lifecycle stage. Your metric should correlate with revenue in trial accounts, paid subscribers, and expansion opportunities. If the correlation breaks down during specific stages, the metric lacks predictive power where it matters most. A metric that correlates with initial conversion but not expansion revenue fails to support long-term growth strategies.
When your value metric reliably predicts which accounts will upgrade, renew, and expand, you have found the measurement that matters most to your business.
Build a predictive model using your metric to forecast next quarter's revenue. Compare predictions against actual results after 90 days. Prediction accuracy above 80% validates your metric choice. Accuracy below 60% means the metric misses critical factors driving revenue, requiring you to reconsider alternatives from your shortlist.
Review customer feedback and support tickets related to usage tracking and billing. Customers complain loudly when metrics feel arbitrary or counting seems incorrect. These complaints signal that your metric either confuses users or creates unintended consequences that harm adoption. Document specific objections and evaluate whether metric adjustments or better communication solves the underlying issues.
Test variations of your metric calculation to improve predictive accuracy. You might discover that active projects matters more than total projects, or that weighted metrics incorporating project complexity outperform simple counts. Run A/B tests with different cohorts to compare which variation best predicts revenue while maintaining customer clarity.
Establish a quarterly review cycle where you examine metric performance against strategic objectives. Your business context evolves, and metrics that worked during initial growth may need adjustment as you enter new markets or shift product strategy. Schedule these reviews but resist changing metrics impulsively based on short-term fluctuations.
Real-world examples show you how different SaaS categories apply value metrics to align pricing with customer outcomes. These examples demonstrate the logic behind metric selection and how teams instrument tracking for each unit of value. You can adapt these patterns to your product by identifying which category most closely matches your value delivery model and customer behaviors. Study how successful teams connect their metrics to both user success and revenue growth.
Teams that build communication platforms measure value through activity that reflects genuine collaboration rather than passive presence. Slack charges based on active users who send messages, while Zoom bills according to meeting participants and duration. These metrics work because they scale naturally as teams rely more heavily on the platform for critical workflows and expand usage across departments.
Consider how collaboration tools instrument their value metrics:
| Product Category | Value Metric | Why It Works | Tracking Method |
|---|---|---|---|
| Team messaging | Messages sent per account | Reflects engagement depth and team dependency | Count unique message IDs by account daily |
| Video conferencing | Meeting minutes consumed | Scales with meeting frequency and team size | Sum duration across all sessions monthly |
| Project management | Active projects or tasks | Shows product centrality to workflows | Track projects with activity in last 30 days |
| Document collaboration | Documents created and shared | Measures content production and collaboration | Count documents with multiple contributors |
Your tracking system should count discrete units that customers can understand and verify. Build dashboards that show customers their current usage relative to plan limits, preventing surprise bills that damage trust. This transparency encourages upgrades when customers see value growing organically rather than feeling manipulated by opaque counting methods.
Products that process or analyze data typically measure value through volume handled or insights generated. Analytics tools charge for data points ingested, reports created, or API calls made. These product value metrics work because customers who analyze more data extract proportionally more business value and demonstrate deeper product dependence that justifies higher pricing tiers.
Track metrics that reflect the transformation your product provides rather than raw inputs. A business intelligence tool measures dashboards created and queries executed instead of just database connections. Data storage platforms count gigabytes stored plus bandwidth consumed for retrieval, capturing both archival and active usage patterns that indicate customer reliance.
When your metric captures both the volume of work processed and the frequency of value delivery, you create natural upgrade triggers as customer success compounds over time.
Developer-focused products measure value through resources provisioned or actions automated. GitHub charges per private repository and user seat, while AWS bills based on compute hours and storage consumed. Continuous integration platforms count build minutes or deployment frequency because these metrics directly correlate with development team productivity and willingness to pay for faster, more reliable infrastructure.
Infrastructure metrics require precision tracking at scale. Implement automated counters that record usage in real time and aggregate data hourly to support accurate billing. Your system needs to handle edge cases like partial hours, concurrent resource usage, and burst capacity without creating billing disputes. Build reconciliation processes that let customers audit their usage and challenge discrepancies before invoices finalize.
Your product value metrics create clarity around what drives revenue and customer success. You stop debating which features to prioritize based on opinions and start making decisions backed by measurable outcomes that predict upgrades, renewals, and expansion. Teams align around a shared understanding of value delivery instead of optimizing for vanity metrics that look good in presentations but fail to move business results.
The framework you built here gives you repeatability. Track your metric weekly and compare actual performance against predictions. When gaps appear between usage patterns and revenue outcomes, investigate whether customer segments behave differently or if external factors distort the relationship. Refine your tracking and analysis quarterly, but resist changing your primary metric impulsively.
Customer feedback becomes more valuable when you connect it to your value metric. Capture feature requests and votes systematically to identify which suggestions come from high-value users whose behavior aligns with revenue growth. Prioritize improvements that help more customers reach the usage thresholds where they extract maximum value and justify premium pricing.

Start today and have your feedback portal up and running in minutes.
