Your product dashboard shows numbers everywhere. Active users are climbing, features are shipping, and your team is busy. But here's the problem: product growth metrics only matter when they tell you what to do next. Most teams drown in vanity metrics while the numbers that actually drive growth sit ignored. You track everything and understand nothing. Your CEO asks why growth is slowing, and you don't have a clear answer.
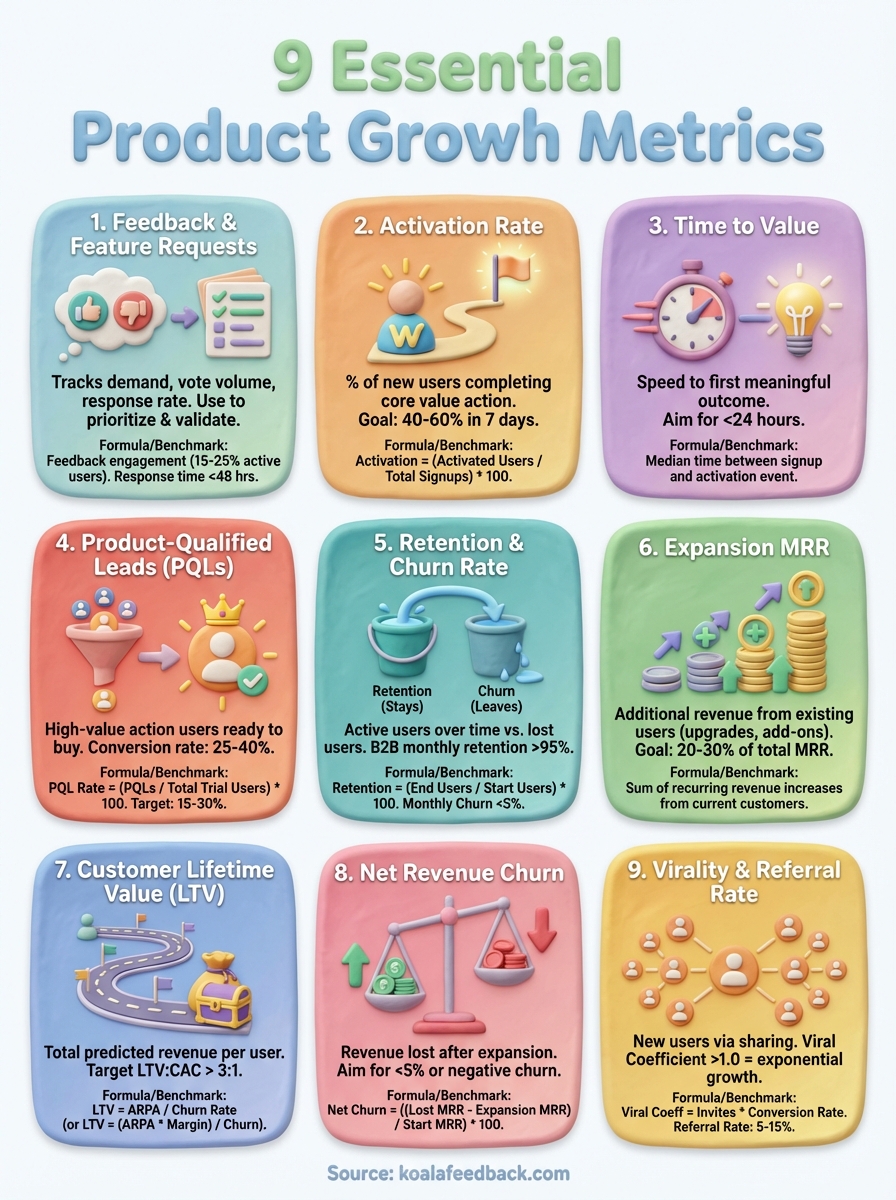
This guide walks you through 9 essential growth metrics that separate winning products from stalled ones. You'll get the formula for each metric, see what good looks like through real benchmarks, and learn exactly how to improve them. No fluff or theory—just the metrics that directly connect to revenue, retention, and sustainable product growth. By the end, you'll know which numbers to watch and what actions to take when they move.
Your product growth metrics start with understanding what users actually want. Feedback volume, request frequency, and vote counts tell you which features will drive adoption before you spend a single development hour. Most teams build in the dark, but tracking these metrics gives you a clear map of user demand. You can measure how many unique requests you receive per month, which features get the most votes, and how quickly you close the feedback loop.
These metrics show you demand concentration and user engagement with your product direction. When 40% of your feedback points to one missing feature, that's a signal you can't ignore. Vote velocity tells you how fast interest builds around specific requests, while response rate measures how many users get answers to their submissions. Strong feedback metrics predict which features will increase activation and retention once you ship them.
You need three numbers: total feedback submissions per month, average votes per request, and time to first response. Calculate your feedback engagement rate by dividing active voters by total users. Track your deduplication rate to see how many submissions point to the same underlying need. A high deduplication rate means users agree on what's missing, making prioritization decisions straightforward.
Products with strong feedback loops see 15-25% of active users submit or vote on requests each quarter. Your average response time should stay under 48 hours, and your implementation rate (shipped features from feedback) should hit at least 30% of top-voted items annually. When these numbers trend up, users feel heard and stay engaged with your roadmap.
Feedback volume without action creates noise. Track what you build from user input, not just what users request.
Koala Feedback automatically tracks submission volume, vote counts, and duplicate detection across your feedback portal. You see which requests cluster together, how voting trends change over time, and which product areas generate the most feedback. Public roadmaps close the loop by showing users exactly what you're building based on their input, driving continued engagement and trust.
Raw feedback metrics only matter when they change your roadmap. High-vote features should move faster through your development pipeline, and common pain points should trigger immediate investigation. Use feedback data to validate your product strategy before major investments. When you ship what users actually request, your activation and retention metrics improve because you're solving real problems instead of guessing.
Your activation rate measures the percentage of new users who complete your core value action within a specific timeframe. This metric separates users who get it from those who bounce. When someone signs up for your product but never activates, they won't convert to paying customers or stick around long enough to generate referrals. Activation rate directly predicts your retention and revenue numbers because activated users have already experienced your product's value firsthand.
Activation rate reveals whether your onboarding flow actually delivers users to their first win. A strong activation rate means your product demonstrates value quickly and clearly. When this number drops, you're either attracting the wrong users or failing to guide them to meaningful outcomes. Product growth metrics like activation rate expose friction points in your early user journey that kill growth before it starts.
Your activation event should be the specific action that proves a user understands your product's value. For a feedback tool, activation might be submitting the first piece of feedback or voting on three requests. Choose an action that requires real engagement and correlates with long-term retention. Data analysis of retained users versus churned users shows which behaviors separate the two groups.
Calculate activation rate by dividing activated users by total new signups, then multiply by 100. If 200 users signed up last month and 140 completed your activation event, your activation rate is 70%. Track this number weekly to spot trends quickly. Time windows matter, so measure activation within your typical trial period or first week of use.
Strong SaaS products achieve 40-60% activation rates within the first seven days. Products with shorter time to value can push toward 70%. Anything below 25% signals serious onboarding problems that require immediate attention. Complex enterprise tools naturally have lower activation rates, but you should still aim for 35% minimum.
Your activation rate sets the ceiling for every downstream metric. Fix this first, then worry about retention.
Start with onboarding improvements that reduce steps to your activation event. Remove unnecessary form fields, auto-populate data where possible, and add in-app guidance that points users toward high-value actions. Test different email sequences that pull inactive users back to complete activation. Show progress indicators so users know how close they are to experiencing value.
Time to value measures how long users take to reach their first meaningful outcome with your product. This metric sits at the heart of product growth metrics because faster value delivery means higher activation rates and better retention. When users wait days or weeks to see results, they abandon your product before experiencing its benefits. Tracking time to value shows you exactly where friction slows down the user journey and prevents people from becoming active, engaged customers.
Time to value controls how many trial users convert to paying customers. Shorter time to value means users experience your product's core benefit before their motivation fades. Products that deliver value in minutes instead of hours capture attention and build trust immediately. Your conversion rates improve when users see tangible results during their first session because they understand what they're paying for.
Immediate time to value happens when users get results instantly, like viewing analytics or accessing templates. Short time to value requires some setup, such as importing data or inviting teammates, and completes within a day. Long time to value spans weeks or months and includes outcomes like reaching ROI targets or completing full implementation cycles.

Measure the time gap between signup and your defined activation event. If users sign up Monday and complete their first valuable action Wednesday, your time to value is two days. Track this across all new users to find your median time to value, which gives you a realistic benchmark that accounts for variations in user behavior.
Users who reach value in the first session are three times more likely to become paying customers than those who take a week.
Strong SaaS products deliver initial value within 24 hours for 60% of users. Products with simple value propositions should aim for under 10 minutes. Complex tools might need 3-7 days, but anything beyond two weeks signals serious problems.
Remove unnecessary steps from your onboarding flow and focus only on actions that lead directly to value. Pre-populate accounts with sample data so users see results immediately. Add progress indicators that show users exactly how close they are to their first win and what steps remain.
Product-qualified leads represent users who have demonstrated meaningful engagement with your product and show clear signals of readiness to buy. Unlike marketing-qualified leads who only fill out forms, PQLs have actually used your product and experienced its value during a trial or freemium period. These users convert at significantly higher rates because they already understand what they're buying. Tracking PQLs as part of your product growth metrics shows how effectively your product sells itself and where your sales team should focus their attention.
A PQL is a user who completes specific high-value actions inside your product that correlate with conversion and long-term retention. This might include reaching usage thresholds, inviting team members, or integrating key tools. Behavioral data from your product identifies PQLs more accurately than demographic information because actions prove intent better than job titles. Users who hit your PQL criteria have proven they need your solution and understand how it works.
Start by analyzing your best customers and identifying the actions they took before converting. Look for behaviors that separate retained customers from churned users, such as completing core workflows or returning multiple times per week. Your PQL signals should be achievable during a trial and require enough engagement to indicate serious interest, not casual browsing.
Calculate your PQL rate by dividing users who meet PQL criteria by total trial or freemium users, then multiply by 100. If 80 out of 200 trial users invite teammates and create three feedback boards, your PQL rate is 40%. Track this monthly to measure how well your activation strategies generate qualified leads.
Strong products generate PQL rates between 15-30% of their trial users. These leads convert to paid customers at 25-40% compared to 1-3% for cold outreach. Sales cycles for PQLs typically run 50% shorter because users already trust your product.
Product-qualified leads convert faster and stay longer because they chose your product based on experience, not promises.
Improve your onboarding flow to guide users directly toward your PQL signals. Add in-app prompts that encourage high-value actions and remove friction from critical workflows. Use targeted messaging to push trial users toward behaviors that indicate purchase intent.
Retention rate measures the percentage of users who continue using your product over time, while churn rate tracks the percentage who leave. These two metrics flip the same coin and directly determine whether your business grows or dies. You can acquire all the users in the world, but without strong retention, you're just filling a leaky bucket. Churn kills growth faster than any other metric because you constantly replace lost revenue instead of building on existing customers.
Retention multiplies the value of every other product growth metrics investment you make. When you retain more users, your acquisition costs deliver returns for years instead of months. Retained customers generate expansion revenue, provide referrals, and require less support than new users. Every percentage point improvement in retention compounds across your entire customer base and dramatically increases your lifetime value calculations.
Divide the number of users active at the end of a period by the number of users you had at the start of that period, then multiply by 100. If you start January with 500 users and 450 remain active by month end, your retention rate is 90%. Track this across different cohorts to see if retention improves as your product matures and which user segments stick around longest.
Calculate churn by dividing customers lost during a period by the total customers at the start, then multiply by 100. Losing 25 out of 500 customers in a month gives you a 5% monthly churn rate. Revenue churn often matters more than user churn because losing high-value customers hurts worse than losing free users who never converted.
Products with monthly churn rates above 5% struggle to achieve sustainable growth without massive acquisition spending.
Strong B2B SaaS products maintain monthly retention rates above 95%, translating to annual churn under 40%. Consumer products typically see 60-80% monthly retention. Enterprise software should hit 98% monthly retention because higher contract values justify more customer success investment.
Focus on improving activation rates first since users who never reach value churn fastest. Add proactive check-ins at 30, 60, and 90 days to catch problems early. Monitor usage patterns to identify at-risk accounts before they cancel, then trigger targeted interventions that address their specific challenges.
Expansion monthly recurring revenue tracks the additional revenue you generate from existing customers through upgrades, add-ons, and cross-sells. This metric belongs in your core product growth metrics because it costs significantly less to expand existing accounts than to acquire new ones. When customers increase their spending, they signal that your product delivers enough value to justify deeper investment. Expansion MRR also offsets churn and creates a path to negative churn, where revenue from existing customers grows faster than revenue lost to cancellations.
Selling to existing customers requires minimal acquisition costs since they already trust your product and understand its value. Your sales cycles shorten dramatically because you skip the education and proof stages that slow down new deals. Expansion deals close faster and predictably because you're working with known quantities instead of cold prospects who might never convert.
Add up all recurring revenue increases from existing customers in a month, including plan upgrades, additional seats, and new module purchases. If three customers upgrade from a $50 plan to $100 monthly and two customers add $30 features, your expansion MRR is $210. Track this separately from new customer revenue to see how effectively your product drives account growth.
Strong SaaS companies generate expansion MRR equal to 20-30% of their total monthly recurring revenue. When expansion revenue exceeds your churn revenue, you achieve negative churn and grow even without new customers. Products with usage-based pricing naturally drive higher expansion rates.
Add usage-based limits that encourage upgrades as customers get more value. Introduce premium features that solve advanced use cases your most engaged customers face. Bundle related products together to increase average account value through cross-selling opportunities.
Expansion revenue compounds because customers who upgrade once typically upgrade again as their usage grows.
Your feedback data reveals exactly what features customers want badly enough to pay more for. Look for highly voted requests from paying customers to identify expansion opportunities that already have proven demand. Users who submit multiple feature requests represent strong expansion candidates because they're actively trying to do more with your product.
Customer lifetime value predicts the total revenue a single customer will generate throughout their entire relationship with your product. This metric stands as one of the most powerful product growth metrics because it shows whether your business model actually works. When you know how much each customer is worth, you can make smarter decisions about acquisition spending, retention investments, and product development priorities. LTV determines how aggressively you can scale and whether your unit economics support sustainable growth.
LTV captures the long-term revenue potential of your customer base rather than just their current spending. This forward-looking view helps you understand whether investing in customer success, new features, or retention programs will actually pay off. Higher LTV numbers mean you can afford to spend more on acquiring customers and still maintain healthy margins because each customer generates substantial revenue over time.
The basic LTV formula divides average revenue per account by your churn rate. If customers pay $100 monthly and you have 5% monthly churn, your LTV is $2,000. More advanced calculations multiply average monthly revenue by gross margin percentage, then divide by churn rate to account for your actual profit margins. Track both versions to see total revenue potential and actual profit per customer.
Your LTV to CAC ratio should hit at least 3:1, meaning each customer generates three times what you spent to acquire them. Strong SaaS companies achieve 5:1 ratios or higher. Ratios below 2:1 signal serious problems with either acquisition efficiency or retention performance that will eventually kill your business.
Businesses with LTV to CAC ratios above 5:1 can scale aggressively because every dollar spent on acquisition returns five dollars in customer value.
Better product experiences directly increase LTV by reducing churn and driving expansion revenue. Users who reach activation quickly and experience consistent value stick around longer and upgrade more often. Small improvements in activation or retention compound across your entire customer base and dramatically lift your average LTV calculations.
Your highest LTV customers deserve special attention when they submit feedback. Priority responses to their feature requests and issues prevent churn in your most valuable segment. Monitor feedback patterns from high-value accounts to spot early warning signs of dissatisfaction before they cancel.
Net revenue churn measures the percentage of recurring revenue you lose from existing customers after accounting for expansion revenue. This metric belongs in your essential product growth metrics because it shows whether your business truly grows or just replaces lost revenue. Unlike customer churn that only counts lost accounts, net revenue churn reveals the actual financial impact of both departing customers and customers who downgrade their plans. Tracking net revenue churn tells you if your expansion strategies successfully offset the revenue bleeding from cancellations.
Gross revenue churn simply calculates the percentage of revenue lost from cancellations and downgrades during a period. Net revenue churn adjusts this number by subtracting expansion revenue from upgrades and add-ons. You might lose $10,000 in gross revenue but gain $12,000 from expansions, creating a negative net churn of -20%. This distinction matters because gross churn makes your business look worse than it actually performs when expansion revenue exceeds losses.

Start with your monthly recurring revenue at the beginning of the month, then subtract revenue lost to cancellations and downgrades. Add back any expansion revenue from existing customers, divide the result by your starting MRR, and multiply by 100. If you start with $100,000 MRR, lose $5,000 to churn, and gain $3,000 from expansions, your net revenue churn is 2%.
Strong SaaS products maintain net revenue churn below 5% monthly or 60% annually. Elite companies achieve negative net churn where expansion revenue exceeds all losses. Products with net revenue churn above 10% monthly struggle to grow sustainably because they constantly replace lost revenue instead of building on their base.
Companies with negative net churn grow revenue even without acquiring a single new customer.
Poor product experience causes most revenue churn when customers fail to reach expected outcomes or encounter repeated friction points. Pricing mismatches emerge when customers feel they're paying too much for the value received. Missing features that competitors offer push customers toward alternatives that better fit their needs.
Monitor usage patterns to identify customers showing declining engagement before they cancel. Build proactive outreach campaigns that address common pain points at risk stages. Create clear upgrade paths that make expansion decisions obvious when customers hit plan limits or need additional capabilities.
Virality measures how many new users each existing user brings to your product through sharing, invites, or natural word of mouth. This metric shows whether your product naturally spreads through your user base or requires constant paid acquisition to grow. Referral rate specifically tracks the percentage of users who actively recommend your product to others and successfully convert those referrals into new signups. These product growth metrics reveal how strong your product market fit really is because people only share products they genuinely value.
Strong viral growth indicates that your product solves a real problem so well that users want others to experience the same benefit. Products that people share organically have found genuine product market fit, while those requiring constant incentives to drive referrals likely miss the mark. User enthusiasm shows in sharing behavior more honestly than survey responses because recommending a product carries social risk that people only take when they trust the product completely.
Calculate your viral coefficient by multiplying the average number of invites each user sends by the conversion rate of those invites. A coefficient above 1.0 means your product grows exponentially through sharing alone. Referral rate divides successful referrals by total active users, showing what percentage of your base actively recruits new users. Track both metrics monthly to understand your organic growth engine.
Most SaaS products operate with viral coefficients between 0.15 and 0.25, meaning every four users eventually bring one new user. Truly viral products hit coefficients above 0.5, while breakthrough viral products exceed 1.0. Referral rates typically range from 5% to 15% of active users, with top performers reaching 20% or higher.
Products with viral coefficients above 1.0 grow exponentially without paid acquisition because each user brings multiple new users.
Build collaboration features that require inviting others to unlock full value, such as shared feedback boards or team voting. Add social proof by showing how many teams use specific features. Make sharing frictionless with one click invite flows and pre-written messages that communicate value clearly.
Your most enthusiastic feedback contributors represent your strongest advocates who already demonstrate product passion. Reach out to these users with referral programs or case study opportunities. Track which features generate the most positive feedback, then highlight those capabilities in referral messaging to attract similar users who will also love your product.
Tracking the right product growth metrics separates products that scale from those that stall. You now have the formulas, benchmarks, and strategies for nine metrics that directly impact your revenue and retention. These numbers tell you where users struggle, which features drive growth, and where your biggest opportunities hide. Most teams measure everything but understand nothing, while you can focus on metrics that actually change outcomes.
Start by focusing on two or three metrics that align with your current growth stage. Fix your activation rate before worrying about virality, and get retention stable before chasing expansion revenue. Track your metrics consistently, but remember that the numbers only matter when they change what you build and how you prioritize features.
Koala Feedback helps you turn user feedback into actionable product decisions by centralizing requests, tracking votes, and showing you exactly what users want most. Your feedback data becomes the foundation for improving every metric we covered.

Start today and have your feedback portal up and running in minutes.
