Product discovery is only as good as your ability to measure it. Without tracking the right product discovery metrics, teams end up relying on gut feeling to decide what to build next, and that's how you burn through sprints on features nobody asked for. Metrics give you proof that your discovery process is actually surfacing the right problems and solutions before you commit engineering resources.
But which metrics actually matter? Some track whether you're talking to the right users, others reveal whether the opportunities you identified translate into real product impact. The challenge is picking a focused set that covers the full discovery cycle, from identifying problems to validating solutions, without drowning in data.
That's exactly what this article breaks down. Below, you'll find nine metrics that help you evaluate discovery effectiveness at every stage. And if you're looking to strengthen the feedback side of discovery, tools like Koala Feedback make it easier to collect, organize, and prioritize user input, so you're measuring discovery efforts built on real user signal, not assumptions.
Feedback signal strength measures how much useful, actionable feedback you're actually collecting relative to the noise in your feedback channels. It's one of the most foundational product discovery metrics because it tells you whether your discovery process is built on real user input or scattered, low-quality submissions that can't inform a single product decision.
This metric tracks the ratio of high-quality, specific feedback to total feedback received over a defined period. A high score means users are submitting detailed, problem-focused input. A low score means you're getting vague comments, duplicate noise, or off-topic requests that don't meaningfully inform what to build next.
Every product has a different bar for what counts as quality feedback. You need to set criteria specific to your context, such as feedback that includes a clear problem statement, references a specific workflow, or ties to an identifiable user segment. Define your quality threshold before you start scoring so the metric stays objective and repeatable across measurement cycles.
If you change the definition of quality feedback mid-measurement, you lose the ability to compare results across time periods.
Divide the number of quality submissions by your total submissions over a given period, then multiply by 100 to get a percentage. For example, if you received 200 submissions and 80 met your quality criteria, your signal strength is 40%. Track this monthly rather than weekly to smooth out spikes from one-off campaigns or product launches.
Koala Feedback's categorization and deduplication tools make it straightforward to separate high-value submissions from noise. You can organize feedback by product area using boards, apply custom statuses, and review which submissions include enough detail to act on. This gives you a reliable dataset to calculate signal strength without spending hours on manual sorting.
A weak signal usually points to one of two problems: your feedback prompts are too open-ended, or you're reaching users at the wrong moment in their workflow. Tighten your prompts to focus on specific tasks or pain points. Add context-triggered feedback requests so users respond when a problem is still fresh. You can also review low-quality submissions to spot recurring themes that reveal gaps in how you're asking.
Feedback deduplication rate tracks the percentage of incoming submissions that match an existing item in your feedback system. It's one of the more underrated product discovery metrics because it tells you whether your system is accurately consolidating user demand or letting the same problems pile up as separate, unlinked entries.
This metric captures how often users independently report the same problem or request across different timeframes or entry points. A high rate confirms that many users share the same frustration, which is a strong signal for prioritization.
Unrecognized duplicates inflate your total submission count without adding new insight. When you treat duplicates as unique requests, you misjudge actual demand and send your discovery process in the wrong direction.
Deduplication isn't about reducing volume. It's about seeing concentrated demand clearly.
Divide the number of merged or flagged duplicate submissions by total submissions received during a set period, then multiply by 100. If you received 300 submissions and merged 90, your deduplication rate is 30%.
| Rate | What it signals |
|---|---|
| High (30%+) | Strong, concentrated demand worth prioritizing |
| Low (under 10%) | Fragmented problems or poorly structured prompts |
Improve your feedback submission interface by surfacing similar existing items before a user finishes a new submission. This pushes users toward voting on existing requests instead of creating noise, keeping your deduplication data accurate without artificially inflating or deflating the numbers.
Customer interview cadence measures how frequently your team conducts structured interviews with real users over a defined period. Tracking this as one of your core product discovery metrics keeps your team anchored to actual user behavior rather than assumptions baked in from previous product cycles.
This metric captures the total number of qualifying interviews completed per week, sprint, or month. It tells you whether discovery is a consistent research habit or something that only happens when a new feature is already in development, which is far too late to change direction.
Solo product teams can sustain two to three interviews per week. Larger teams with dedicated researchers can run five or more. The goal is consistency over volume, so pick a number you can hit reliably rather than overcommitting and letting the cadence collapse under delivery pressure.
A qualifying interview is a scheduled, structured conversation focused on understanding a specific user problem or behavior. Casual Slack messages, support tickets, and sales calls do not count, even if they produce useful insight.
Count only conversations where you deliberately set out to learn, not conversations where learning happened by accident.
Log each interview against a user segment or persona so you can spot gaps in coverage. If you've spoken to ten power users and zero occasional users this quarter, your discovery is missing a key perspective.
Teams sometimes count internal stakeholder interviews or replayed session recordings as user interviews. Neither substitutes for a direct conversation with an actual user who experiences the problem you're investigating.
Time to validated problem measures how long your team takes to move from a raw user signal to a clearly defined, evidence-backed problem statement. This is one of the more revealing product discovery metrics because it exposes how efficiently your discovery process converts messy input into something your team can actually act on.
This metric tracks the number of days or weeks between when your team first identifies a potential problem and when it formally validates that problem with enough research evidence to justify further investment. A long cycle often signals process bottlenecks, not just heavy workload.
A validated problem is one that meets a specific evidence bar you define upfront. That typically means you've spoken to a minimum number of users who confirm the problem, observed the behavior directly, and ruled out alternative explanations. Document your criteria before research begins so validation stays consistent across discovery cycles.
Changing your validation criteria after research starts undermines the integrity of the metric entirely.
Subtract the date of first problem identification from the date your team signs off on a validated problem statement. Average this across all problems investigated in a quarter to get a reliable baseline.
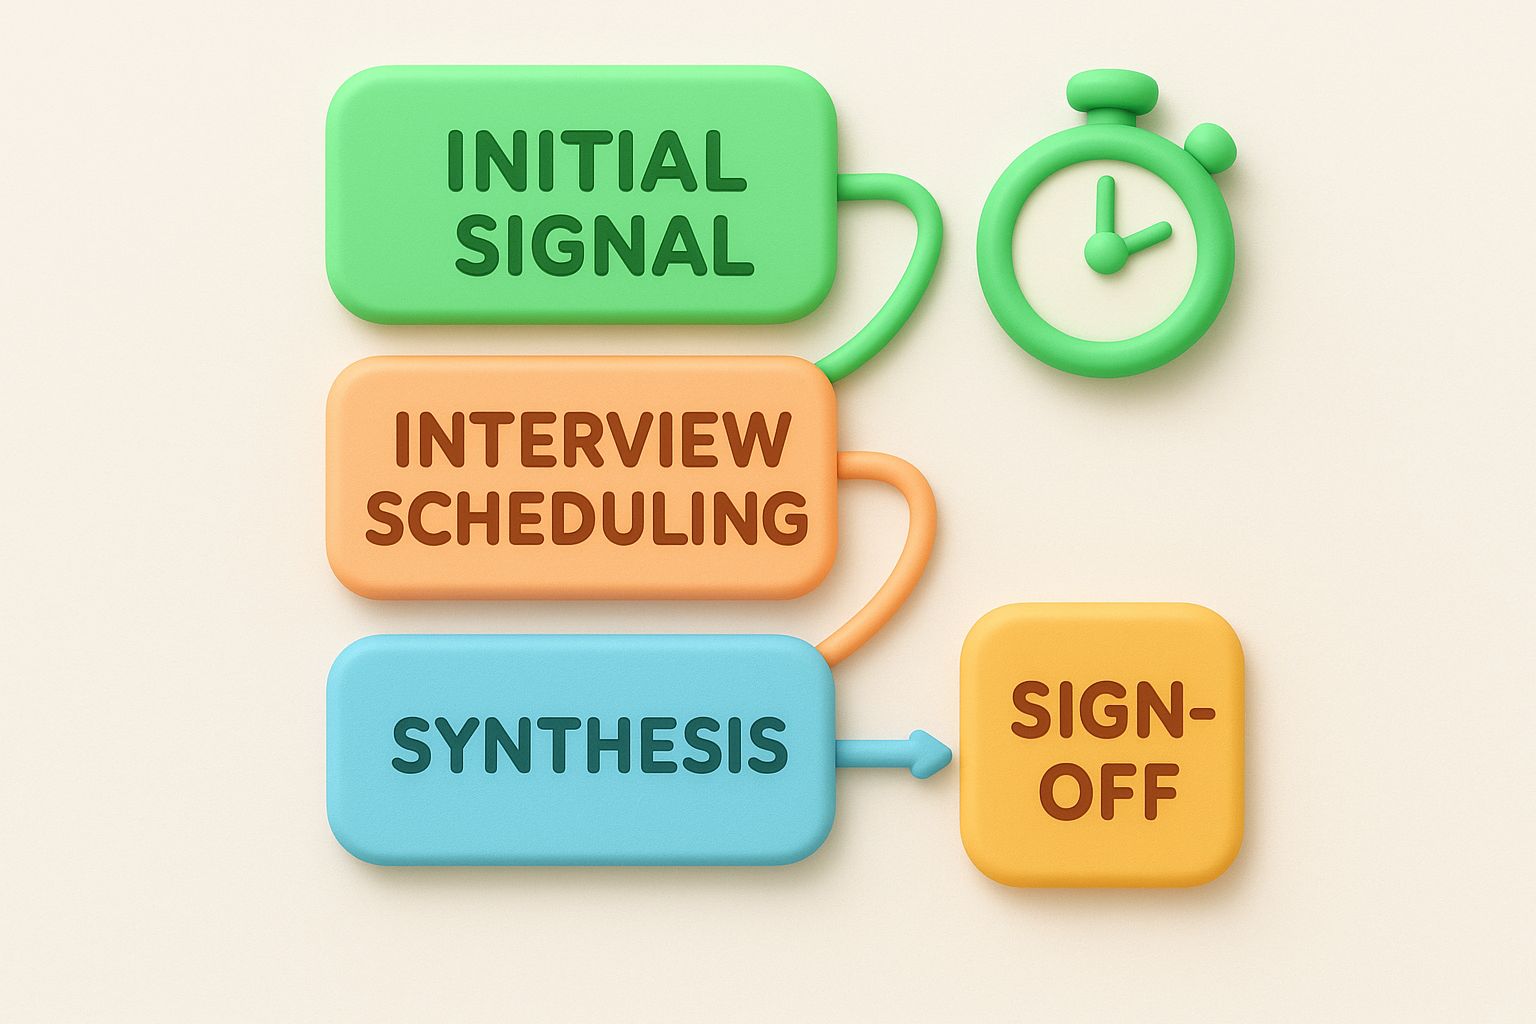
Log timestamps at each phase: initial signal, interview scheduling, synthesis, and sign-off. This shows you exactly where time accumulates, whether in scheduling gaps, slow synthesis, or approval delays.
Standardize your research templates so each investigation starts from the same structure. Cutting setup time at the start, rather than skipping steps at the end, keeps your validation quality intact while shortening the overall timeline.
Experiment throughput measures how many discovery experiments your team completes over a defined period, typically a sprint or month. Tracking this alongside your other product discovery metrics reveals whether your team is actively testing assumptions or mostly debating them in meetings.
This metric captures the total number of completed experiments per unit of time. It tells you whether discovery is generating real evidence or stalling at the hypothesis stage.
An experiment is any structured test with a defined hypothesis and a measurable outcome set before you run it. The following qualify:
An experiment requires a hypothesis, a method, and a measurable outcome defined before you run it.
Reviewing analytics reports or reading prior research does not count, even when useful insight comes out of it.
Divide total completed experiments by the number of sprints or months in your measurement window. If your team ran 12 experiments across three months, your throughput is four per month. Track this consistently so you can spot drops tied to delivery pressure.
Higher throughput only matters if each experiment produces a clear, usable result. Running shallow tests purely to inflate the number erodes decision quality. Set a minimum evidence standard for what makes an experiment complete before it counts toward this metric.
Reduce setup friction by maintaining reusable experiment templates your team can adapt for each new test. Pre-recruiting a standing panel of participants cuts scheduling delays significantly, letting your team move from hypothesis to results without losing weeks to calendar gaps.
Actionable learning rate is one of the product discovery metrics that tests whether your research actually influences decisions. It tracks the percentage of completed experiments or interviews that produce learning your team directly applies to a product or process decision.
This metric captures how often discovery outputs convert into a concrete next step, whether that's narrowing a problem scope, killing an idea, or confirming a direction to pursue. It separates teams that learn from teams that collect.
Actionable learning is any research output that triggers a documented decision. That means your team changed course, confirmed a bet, or explicitly ruled something out based on the evidence. Observations that sit in a research doc with no follow-up action do not count.
Learning only earns this label when it moves a decision forward.
Divide the number of research outputs that triggered a documented decision by the total outputs produced in a period, then multiply by 100. If you ran 20 experiments and 12 changed or confirmed a decision, your rate is 60%.
Log each research output with a decision tag at the moment you close the research. Tags should note whether the output led to a go, no-go, pivot, or holding pattern. This lets you audit patterns over time and identify which research methods consistently produce useful results.
Sharper hypotheses produce more actionable outputs because they force you to define what a result means before you run the research. Write each hypothesis with a clear decision trigger, so your team knows what learning will shift the direction.
Idea validation rate tracks the percentage of tested ideas that meet your predefined evidence bar for moving forward, whether that means advancing to development, running a deeper experiment, or cutting the idea entirely. Among all product discovery metrics, this one directly measures how well your discovery process separates strong bets from weak ones before your team commits real resources.
This metric captures how often your team reaches a clear go or no-go decision after testing an idea through structured discovery. It shows whether your validation process is producing confident decisions or just generating more ambiguity at the end of each research cycle.
Your evidence bar should specify the minimum signals required before an idea advances. Define this before testing starts so decisions stay consistent and your team cannot move the goalposts after results come in.
Setting your evidence bar after you see the results is not validation; it is rationalization.
A standard bar might require confirmed demand from a minimum number of interviews, a measurable engagement signal from a prototype test, or explicit willingness-to-pay evidence from users in your target segment.
Divide the number of ideas that meet your evidence bar by the total ideas tested in a period, then multiply by 100.
Cherry-picking supportive quotes while ignoring contradictory signals corrupts this metric fast. Log both confirming and disconfirming evidence for every idea so your decisions reflect the full picture, not just the data that supports your original assumption.
A low idea validation rate signals that your team is testing ideas too early, before they are specific enough to evaluate fairly. Use the metric to push problem definition work earlier in your process, so only ideas with clear problem-solution alignment enter structured validation.
Decision latency measures how long your team takes to move from validated research evidence to a formal product decision. It's one of the more overlooked product discovery metrics because teams often assume slow decisions are a leadership problem, not a discovery system problem.
This metric captures the number of days between closing a discovery research cycle and recording a documented go, no-go, or pivot decision. Long gaps signal that validated insights are sitting idle instead of driving action.
Slow decisions don't just delay delivery. They decay the value of your research because market conditions, user behavior, and competitive context all shift over time. Research that was accurate when you collected it loses relevance fast when decisions stall for weeks.
Fresh evidence drives better decisions, so the longer your team waits to act, the less reliable your discovery inputs become.
Log the date research formally closes and the date your team records a decision. Average this gap across all decisions in a quarter to establish a reliable baseline you can track over time.
Most latency accumulates in review queues and stakeholder handoffs, not in the research itself. Decisions often stall because the right people aren't in the room when findings are shared, or because no single owner is accountable for closing the decision loop.
Share research findings in short, structured summaries rather than full research documents. Stakeholders engage faster when they can see the key evidence and decision options on a single page without reading through an entire research report.
Discovery to delivery success rate is one of the most important product discovery metrics because it closes the loop between your research process and real-world outcomes. It tracks what percentage of shipped features actually deliver the results your discovery work predicted.
This metric captures how often your discovery evidence translates into measurable product impact after a feature ships. It forces your team to treat discovery as a predictive system, not just a research exercise.
Before a feature ships, document the specific outcome your discovery predicted, whether that's adoption, retention improvement, or task completion. Link that prediction to the delivered feature so you can measure the actual result against the original discovery rationale.

Discovery evidence is only useful if you record what you expected it to prove before the feature ships.
Divide the number of features that hit their predicted outcome by the total features shipped in a period, then multiply by 100. Use adoption rate and retention delta as your primary signals since both reflect whether users actually value what you built.
Give shipped features at least 60 to 90 days before evaluating outcomes. Early adoption signals are noisy, and retention patterns need time to stabilize before you draw conclusions.
When a feature misses its predicted outcome, trace the failure back through your discovery steps to identify where the evidence broke down. Pattern analysis across multiple misses reveals systemic gaps in your research methods.
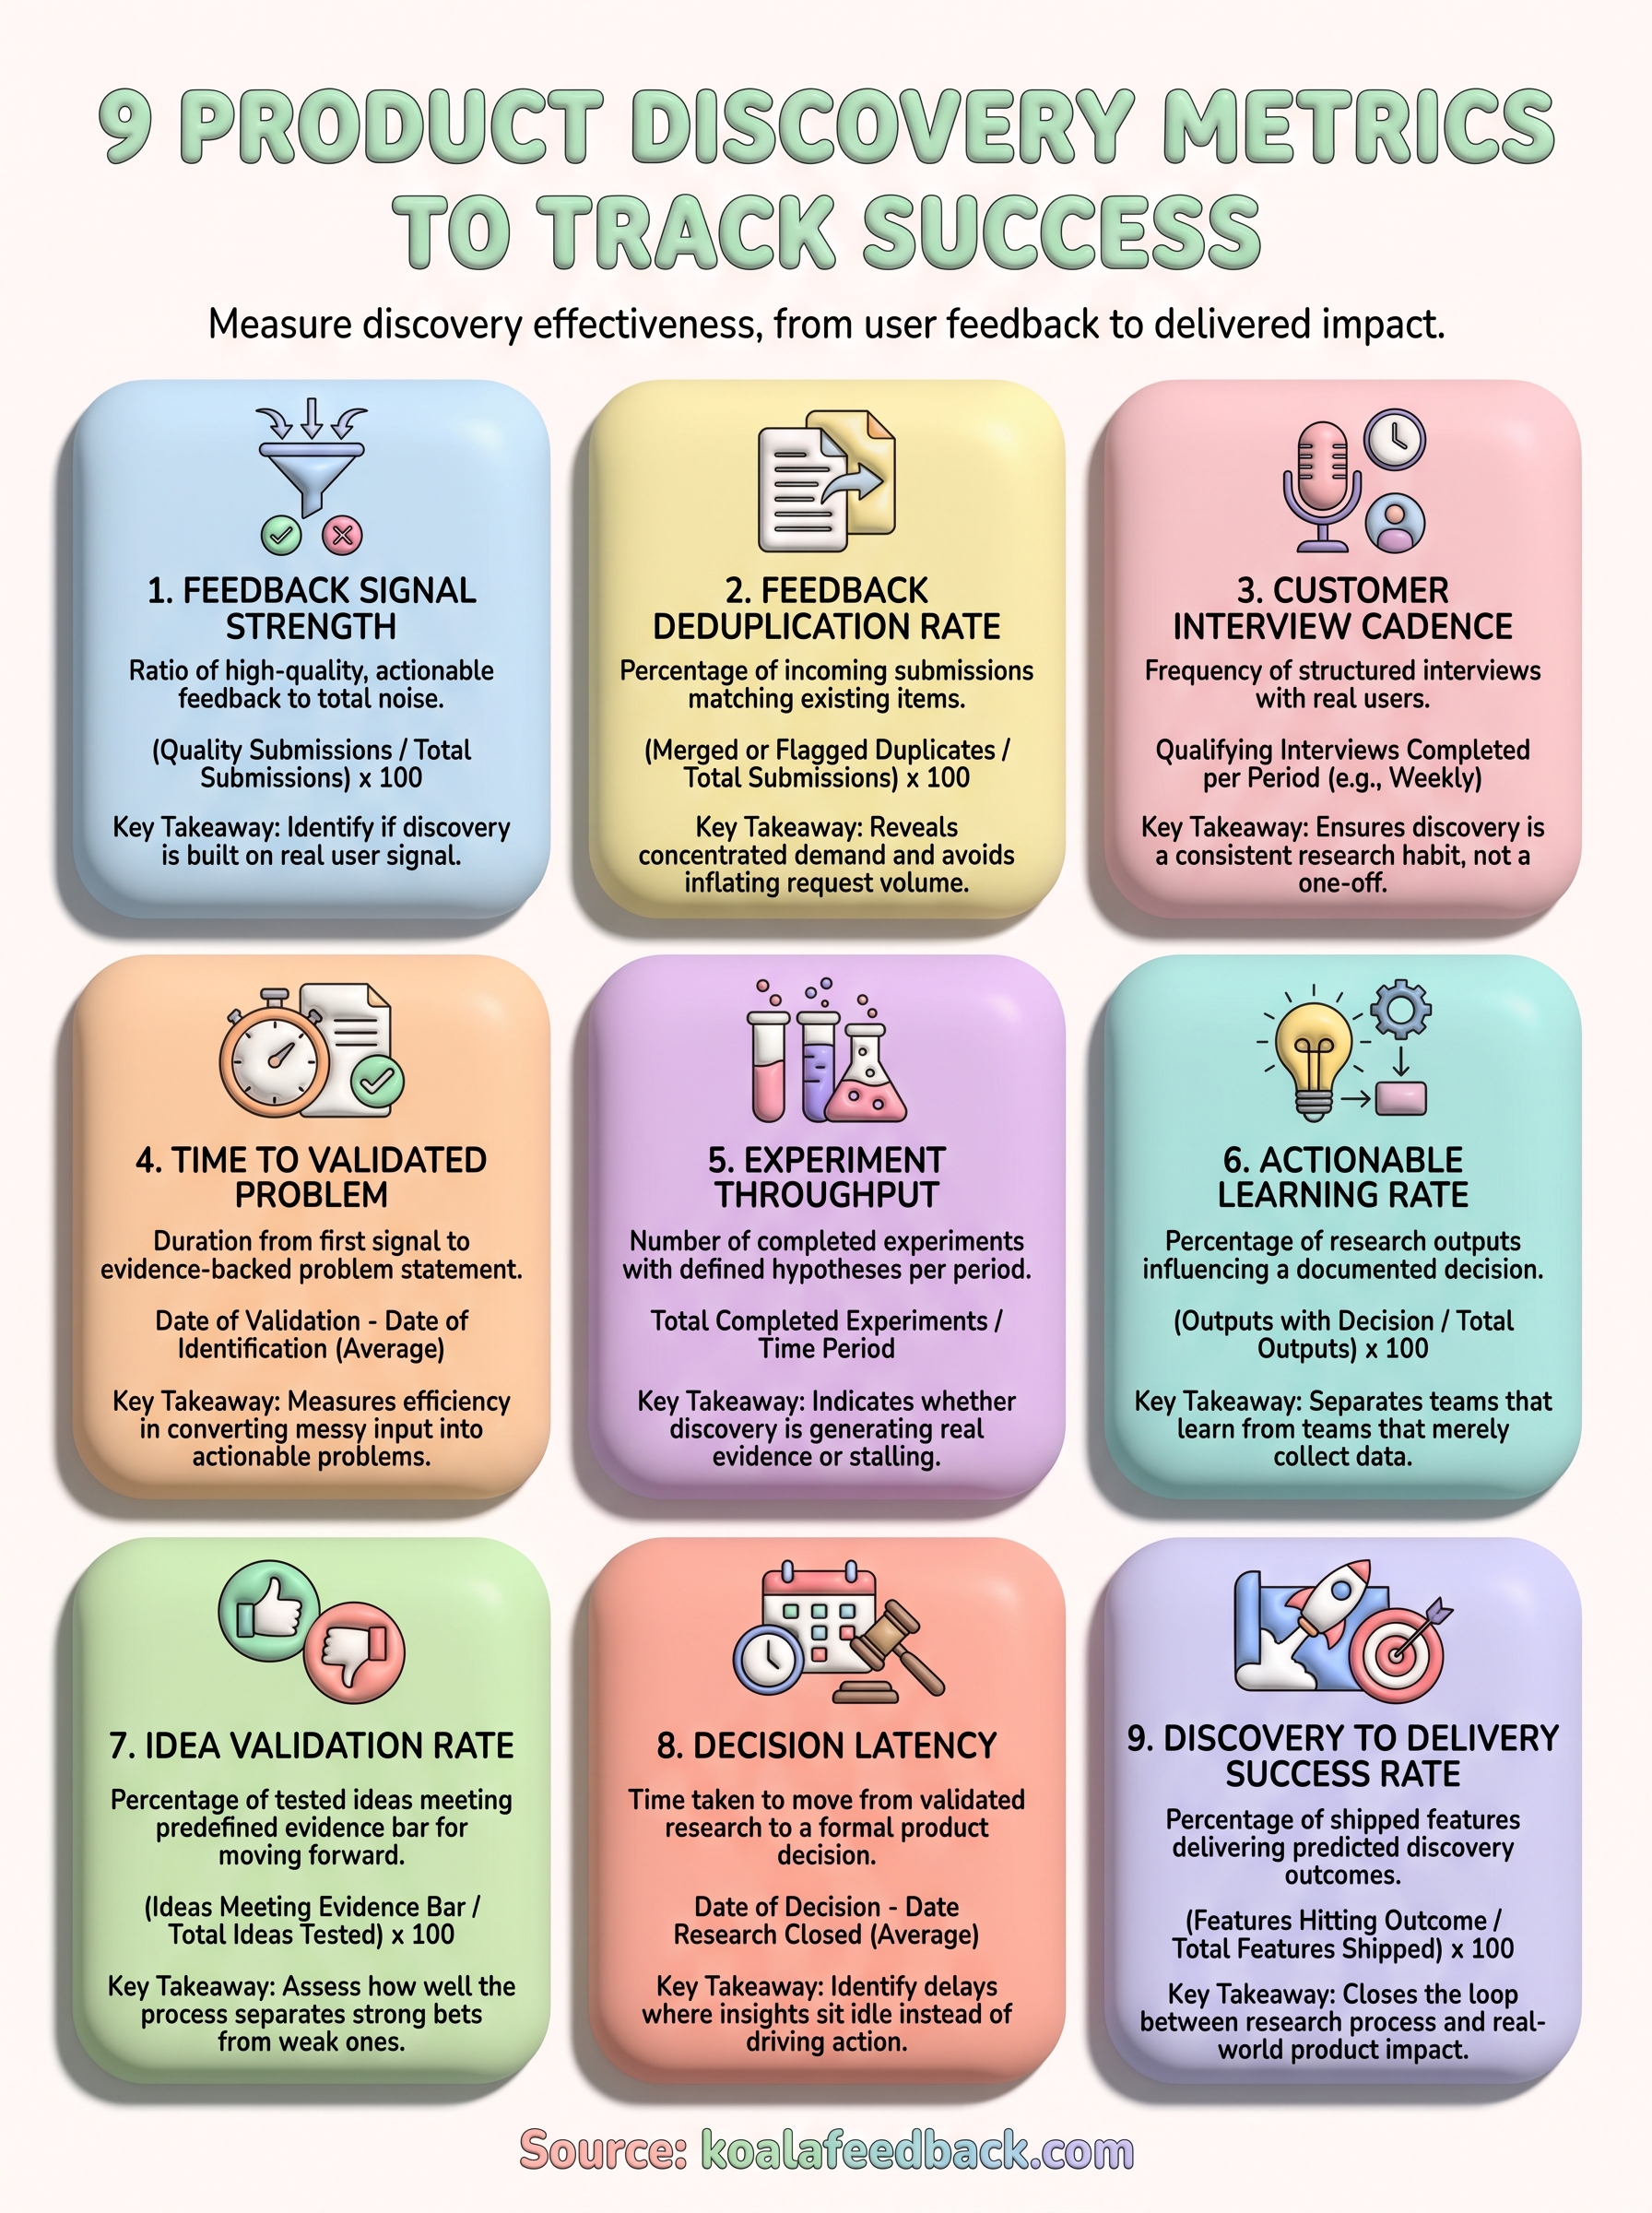
Tracking these nine product discovery metrics gives you a clear picture of where your process is working and where it's leaking time, effort, and budget on the wrong problems. Start by picking two or three metrics from this list that map to your biggest current gap, whether that's feedback quality, decision speed, or delivery outcomes, and build a consistent measurement habit before adding more.
Your feedback system is the foundation every other metric depends on. If you're collecting scattered, unorganized feedback, your signal strength and deduplication rate will never give you reliable data to act on. Koala Feedback gives you a centralized place to collect, categorize, and prioritize user input, so your discovery process starts from actual user demand rather than internal guesswork. Set up your measurement system, sharpen your feedback collection, and your entire discovery cycle will produce better decisions faster.

Start today and have your feedback portal up and running in minutes.