Most teams collect feedback from their users but treat it as one big pile. A bug report from an enterprise client gets the same weight as a nice-to-have from a free-tier user. The result? Product decisions that feel like guesswork. Customer segmentation insights change that by helping you understand who is asking for what, and why it matters for your business.
When you segment your customers and analyze their feedback through that lens, patterns emerge. You start to see which groups drive the most revenue, which needs are going unmet, and where your roadmap should actually point. It's the difference between building features that look good on paper and building features that move the needle.
At Koala Feedback, we built our platform around this idea, that feedback only becomes useful when you can categorize, prioritize, and act on it with clarity about who it's coming from. This article breaks down the core methods for segmenting customers, the KPIs worth tracking, and real-world examples that show how segmentation turns raw feedback into concrete product and marketing decisions.
Without segmentation, your feedback data is noise. You might have hundreds of feature requests sitting in a backlog, but without knowing who made them or how much revenue those users represent, you have no real way to prioritize. Customer segmentation insights give your feedback context, and context is what turns raw data into concrete decisions your whole team can act on.
When you understand which segment a piece of feedback comes from, you can weigh it properly. A power user who accounts for 40% of your revenue asking for a deeper integration carries far more immediate product priority than a casual user asking for a cosmetic change. Neither request is invalid, but without segmentation you treat them the same, and that produces a roadmap that satisfies no one particularly well.
Segmenting your feedback by user type before prioritizing features can cut the time your team spends debating the backlog by a significant margin.
Segmented product decisions also reduce churn. When you build for the users who actually drive your business, those users stay longer. Retention improves when people see their real needs reflected in your product updates instead of generic releases aimed at a broad, undefined audience that may not even exist.
You cannot understand where your revenue comes from by looking at aggregate data alone. Segment-level analysis shows you which customer groups generate the most value and which ones are leaving money on the table. A SaaS company might find that mid-market teams convert at twice the rate of solo users but receive half the product investment, purely because solo users happen to submit more visible feedback.
Breaking down metrics by segment also exposes pricing and packaging mismatches. If enterprise users consistently request advanced workflow features that free-tier users never mention, you have a direct signal about where to focus your upsell strategy and where your current tier structure might be underpriced.
One of the most practical uses of customer segmentation insights is identifying the customers who are quietly struggling. These users rarely submit feedback because they assume their needs are too niche to matter. When you look at engagement patterns by segment, low activity usually signals unmet needs rather than satisfaction.
Spotting these groups early gives you the chance to reach out proactively, build features that address their specific pain points, and convert passive users into loyal advocates. The cost of building for an underserved segment is almost always lower than the cost of replacing churned users you never realized were at risk.
The quality of your customer segmentation insights depends entirely on the data you feed into them. Poor data produces misleading segments, and misleading segments produce bad decisions. Before you start grouping customers, you need to identify which data sources actually reveal meaningful differences between your users.
Usage patterns are among the most reliable signals you have. How often do users log in? Which features do they use most? Where do they drop off? This data comes directly from your product analytics and shows you how different customers actually interact with what you built, not how they say they do.
Behavioral data tells you what users do, while survey data tells you what they think they do. Both matter, but they rarely say the same thing.
Session frequency, feature adoption rates, and time-to-value all help you identify power users, casual users, and at-risk users without relying on assumptions.
For B2B products, firmographic data such as company size, industry, and annual revenue gives you a structural picture of who your customers are. Combine this with demographic information like job title and team size, and you can see which customer profiles convert best and which ones churn fastest.
You collect this data through your signup flow, CRM, or enrichment tools that append public company data to your existing records automatically.
Feedback submissions and support tickets reveal what your customers want and where they struggle. When you tag and categorize this data by segment, you stop seeing individual complaints and start seeing patterns. An enterprise user mentioning slow exports three times a month is a different signal than a solo user mentioning it once.
Structured feedback platforms make this segmentation repeatable, so your team spends time acting on insights rather than sorting through raw input.
Generating customer segmentation insights is a deliberate process, not a one-time data pull. If you skip steps or work from incomplete data, you end up with segments that look clean on a spreadsheet but don't reflect how your customers actually behave. Follow these steps in order to build segments you can act on.
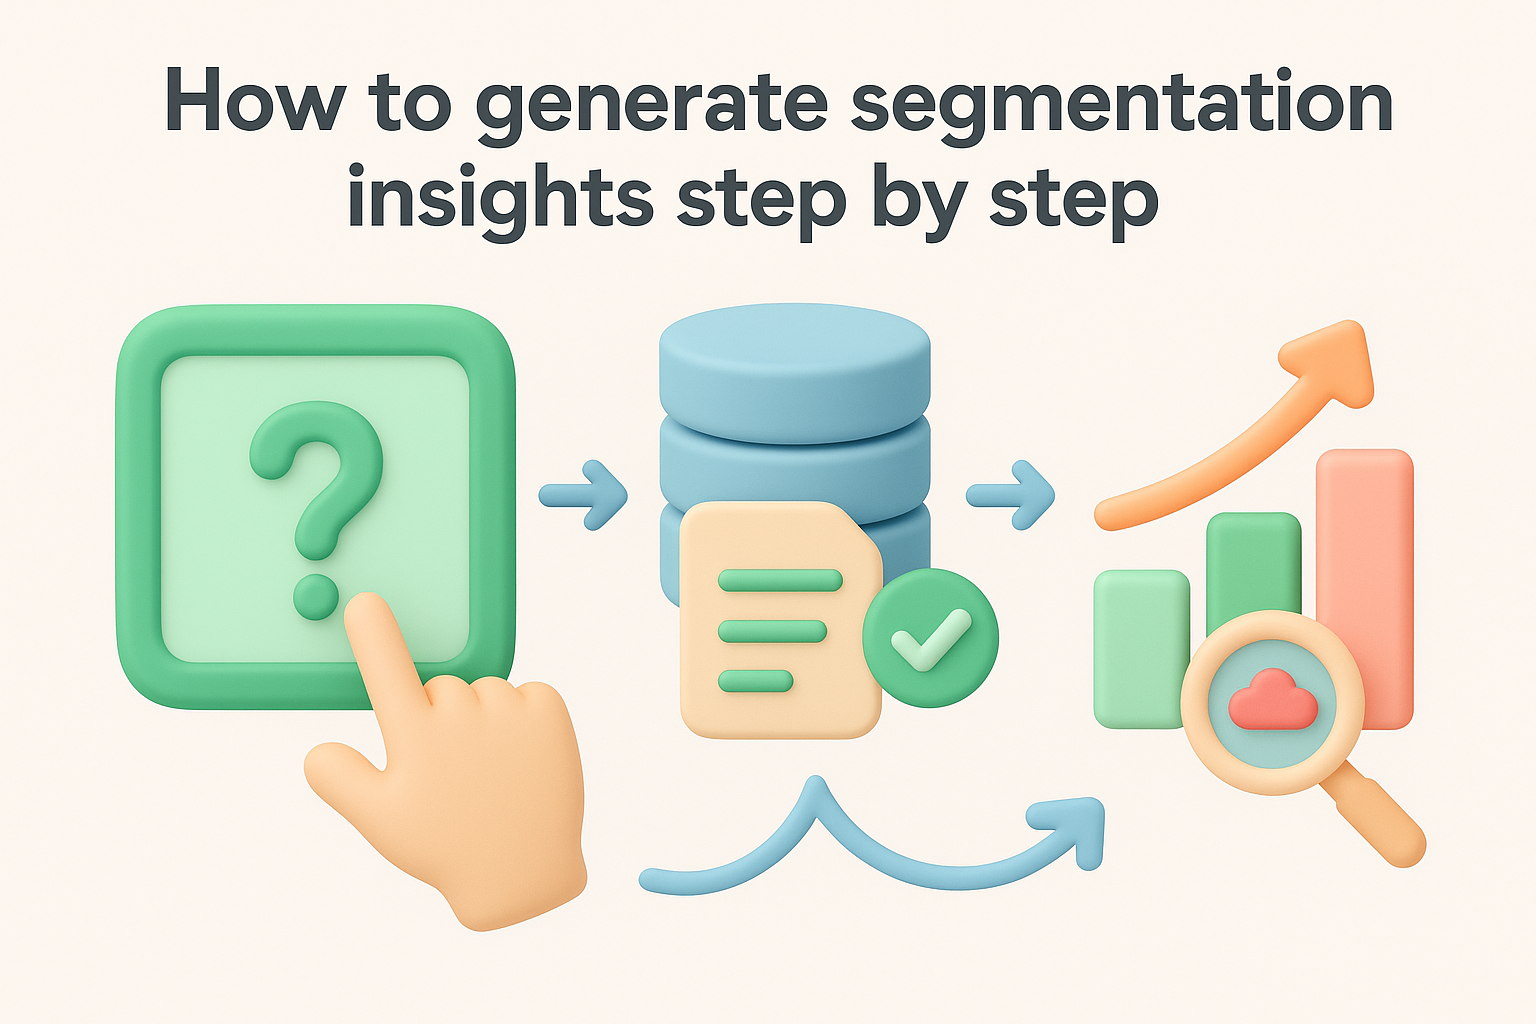
Before you touch any data, decide what question you're trying to answer. Are you trying to understand which customers churn fastest? Which ones expand their accounts? Which ones submit the most support tickets? Your criteria should match the business problem you're solving. Start with one or two clear variables like company size and feature adoption rate, rather than trying to segment across every dimension at once.
Once you know your criteria, pull data from the relevant sources: your CRM, product analytics, and feedback platform. Clean the data before you do anything else. Duplicate records, missing fields, and outdated entries produce false patterns that mislead your entire analysis. After cleaning, tag each record with the segment attributes you defined in the previous step so every piece of data is sortable and comparable.
Tagging feedback submissions with segment attributes at the point of collection saves hours of manual work during analysis.
With tagged data in hand, look for patterns that repeat across multiple users in the same segment rather than focusing on individual outliers. Enterprise users might request the same feature type consistently, while churned users might share a common onboarding behavior. Once you spot a pattern, validate it against a second data source before treating it as a confirmed insight. A pattern that shows up in both your feedback data and your usage analytics is one worth acting on.
Not every segmentation method gives you actionable customer segmentation insights. Some approaches divide your audience into buckets that look clean in a presentation but tell you nothing about what to build next. The three methods below focus on behavior, needs, and revenue value because those factors connect your customer data directly to decisions your team can act on.
Behavioral segmentation groups users based on what they actually do inside your product: features used, login frequency, and actions completed before churning or upgrading. This method works because it reflects real engagement patterns rather than assumed intent based on job title or company size.
Users in the same demographic group often behave completely differently inside your product, which makes behavior a stronger predictor of needs than firmographic data alone.
Feature adoption rates and session depth are two strong starting points. Users who adopt three or more core features within their first two weeks typically retain at much higher rates than users who stick to only one.
Needs-based segmentation groups customers by the specific problems they are trying to solve, rather than by who they are or how often they log in. You surface these needs through structured feedback submissions, support ticket patterns, and direct customer interviews. This method catches product gaps that purely behavioral data misses because users sometimes work around limitations without flagging them explicitly.
When you map feedback to distinct need categories, recurring themes within a segment point directly to your next most valuable feature investment.
RFM stands for Recency, Frequency, and Monetary value. It groups customers by how recently they engaged, how often they engage, and how much revenue they represent. This method helps you identify high-value users who deserve proactive support and low-engagement users who may be at churn risk before they signal it directly.
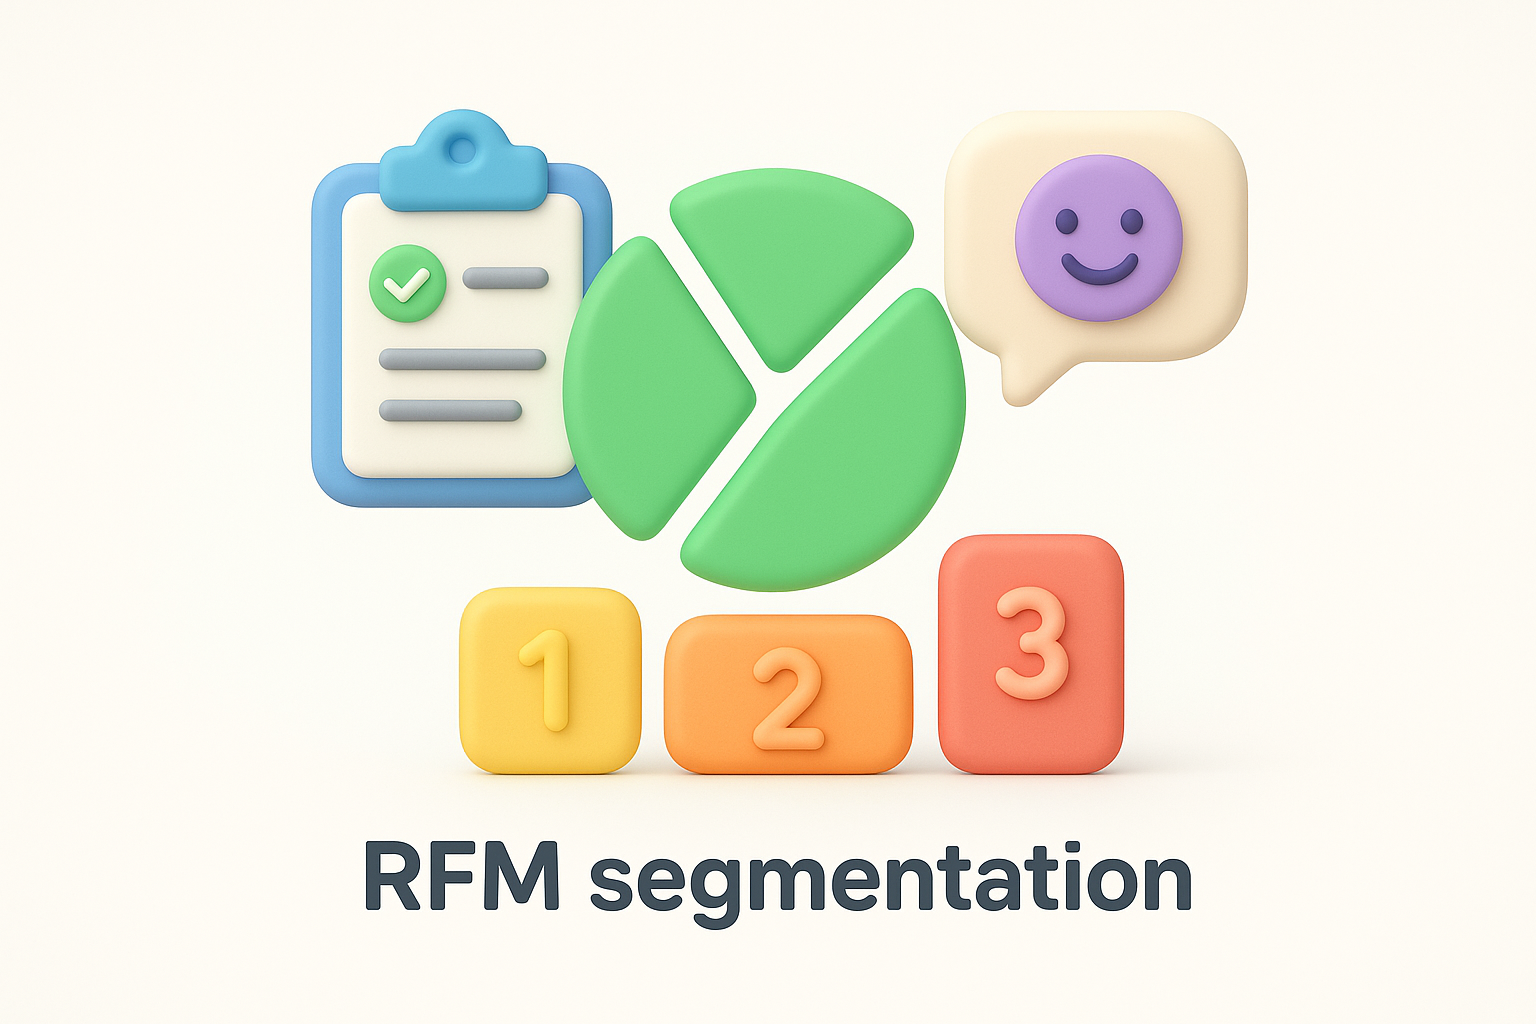
Combining RFM scores with feedback data lets you prioritize requests from your most valuable segments without manually sorting through every submission.
Tracking the right KPIs at the segment level turns your customer segmentation insights into a reliable decision-making tool. Without segment-level measurement, you track average performance across your entire user base, which hides the signals that matter most. Segment-specific metrics show you where growth is happening, where it is stalling, and which user groups need your immediate attention.
Monthly active usage rate and churn rate by segment reveal the most about product-market fit within each group. A segment with high engagement but high churn usually points to a pricing or value communication problem rather than a core product gap. Track both metrics together to separate users who value the product but leave anyway from users who never fully engaged.
Feature adoption rate by segment adds another layer to this picture. When a specific group consistently skips a feature you built for them, that is a direct signal to revisit your onboarding flow or reconsider whether that feature solves their actual problem.
Differences in churn rate across segments often expose onboarding gaps before they appear in your aggregate numbers.
Average revenue per user (ARPU) and net revenue retention (NRR) by segment tell you where your real growth originates. High NRR within a segment confirms strong product-market fit and signals that those users are expanding their accounts over time. Expansion revenue by segment also shows you which customer profiles carry the highest ceiling, so you can direct your upsell focus more precisely.
Net Promoter Score (NPS) and feedback submission rate by segment round out the picture by showing how different groups perceive your product and how invested they are in shaping it. A segment that submits frequent feedback is actively engaged, while a quiet segment may be disengaging well before any churn signal appears in your dashboard.
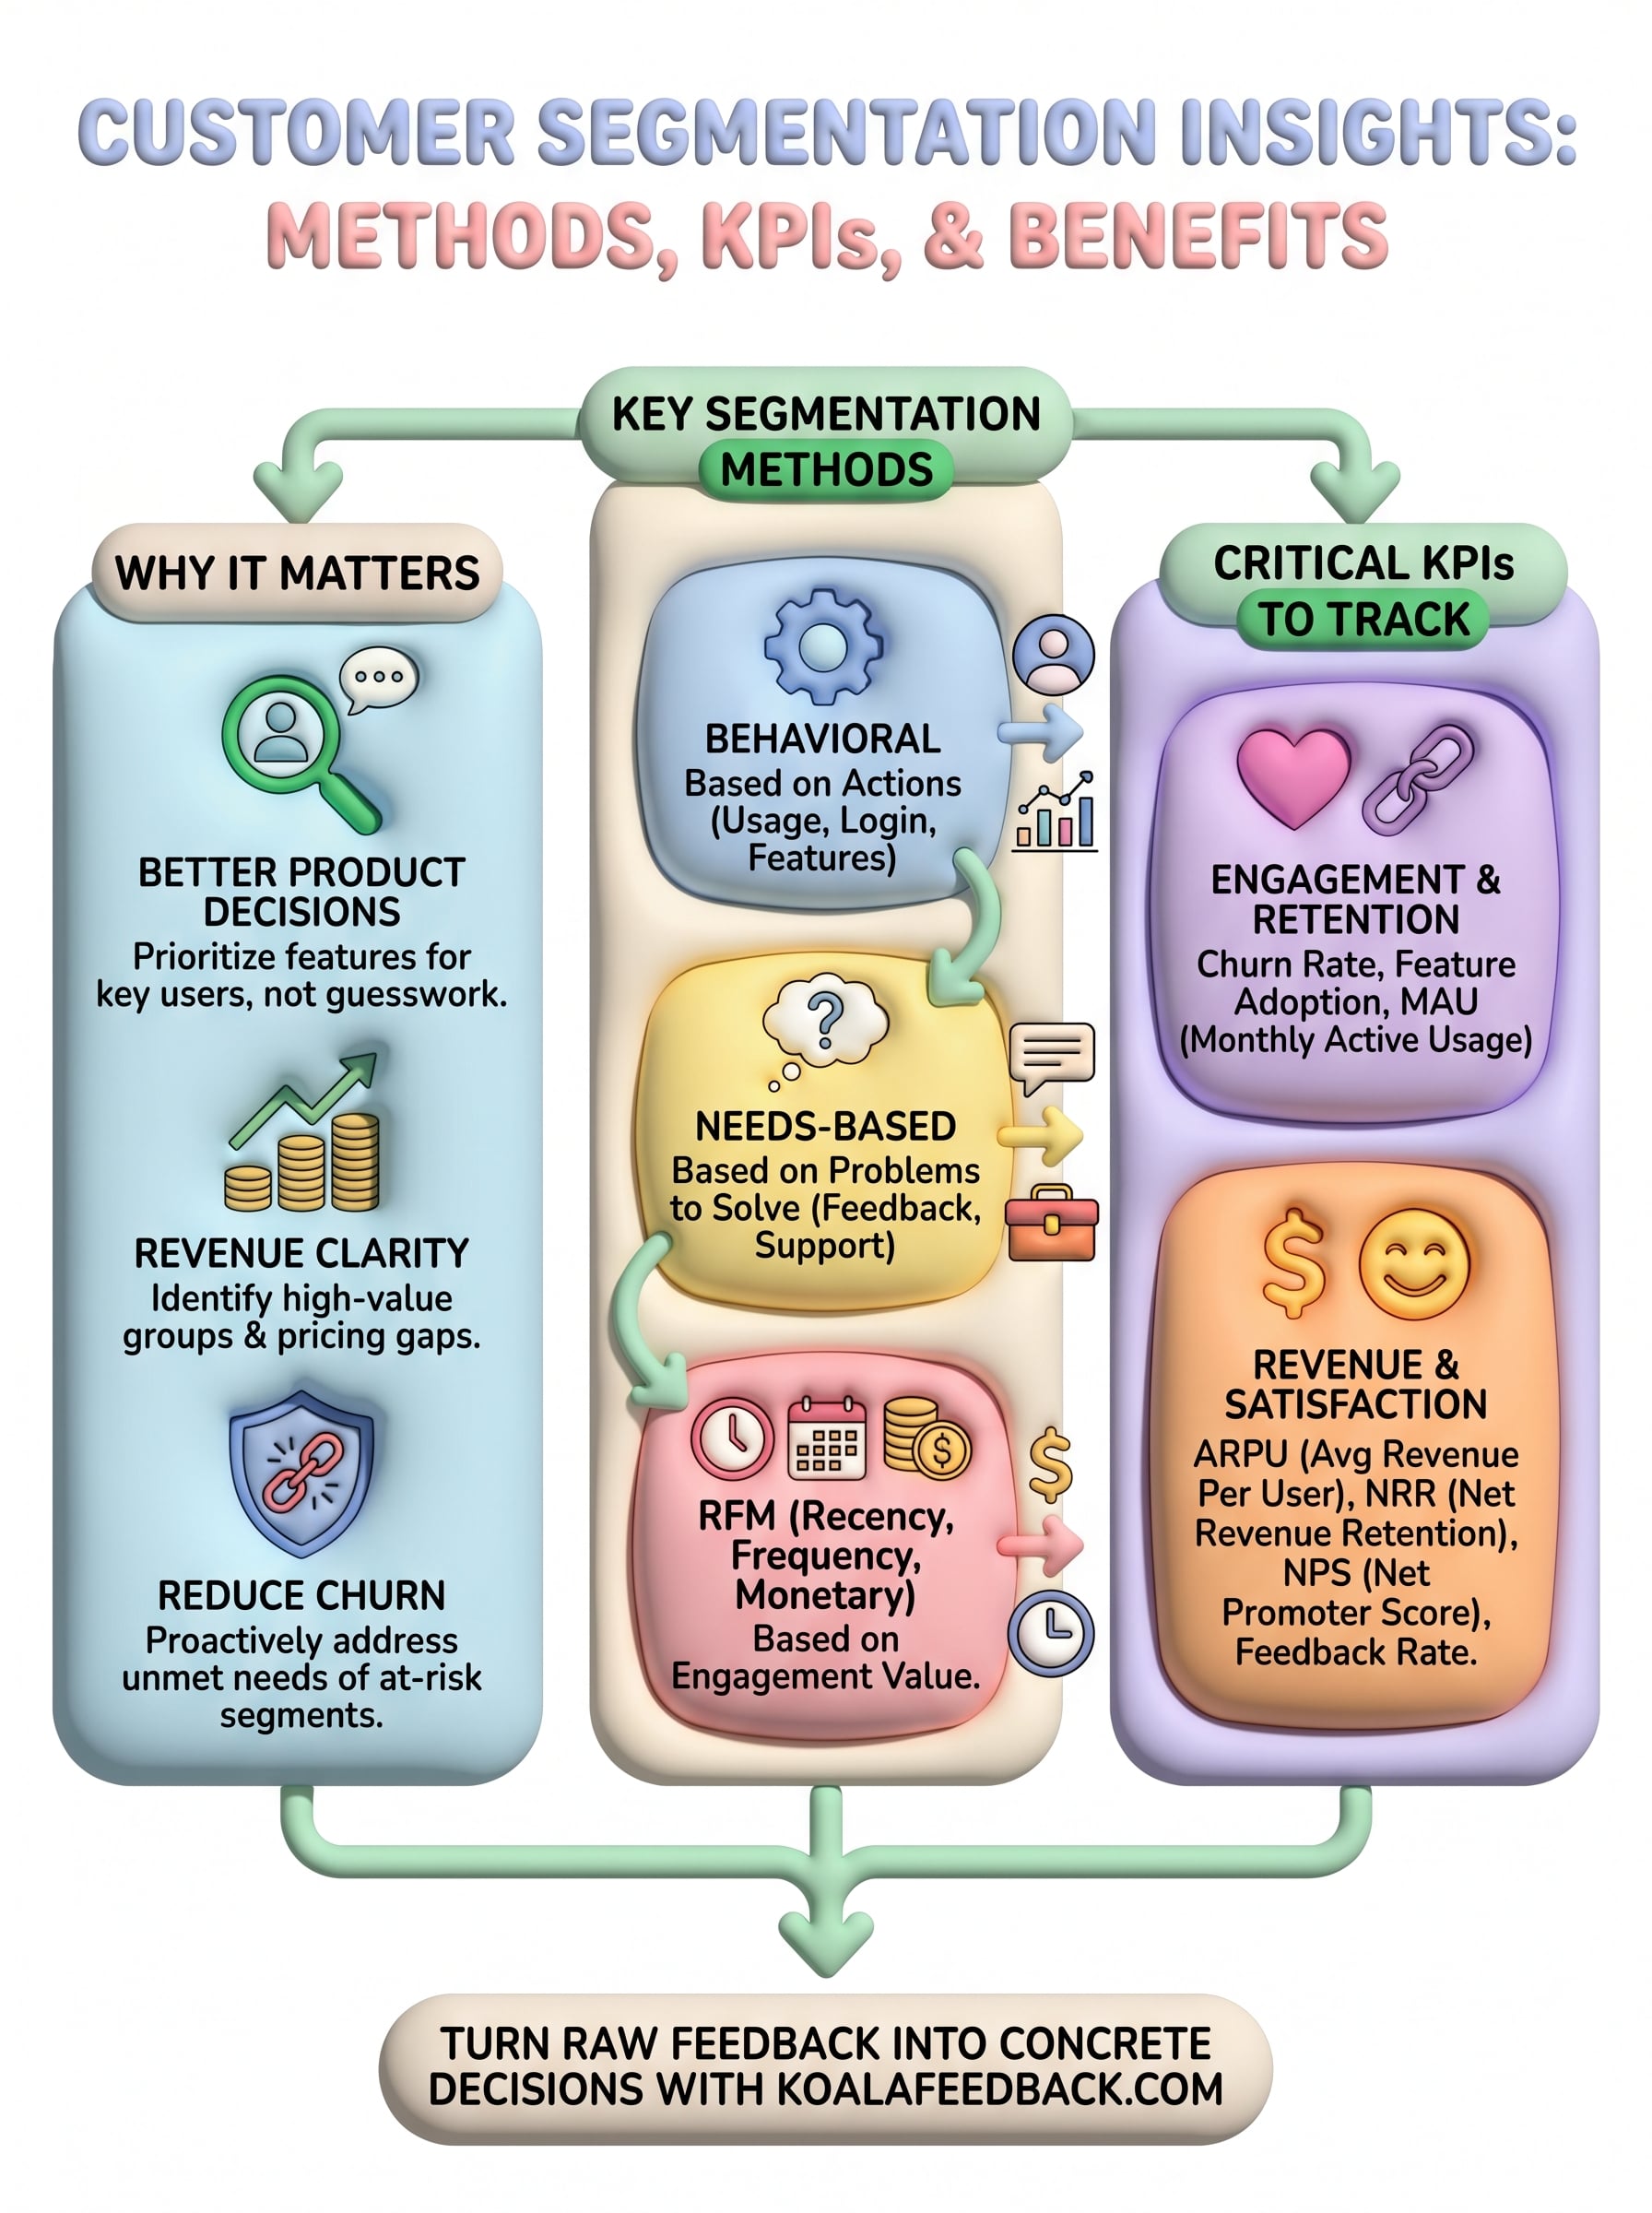
Customer segmentation insights work only when you act on them consistently, not just during quarterly reviews. The methods, KPIs, and examples in this article give you a complete framework for turning raw feedback into decisions that reflect who your most valuable users are and what they actually need from your product.
Start small. Pick one segmentation variable, behavioral or firmographic, and apply it to the feedback you already have. Look for patterns that repeat across at least three users in the same segment before treating any finding as actionable. Then track one or two segment-level KPIs for 30 days to confirm whether the pattern holds.
The biggest barrier most teams hit is scattered feedback with no structure to segment by. A dedicated feedback platform removes that barrier by tagging and organizing input at the point of collection. Start collecting and segmenting user feedback with Koala Feedback to turn your next batch of submissions into a roadmap your whole team can trust.

Start today and have your feedback portal up and running in minutes.