Most SaaS teams collect feedback. Few actually turn it into something useful. The difference between the two? Knowing how to extract customer insights examples that drive real product decisions, not just hoarding data in a spreadsheet and hoping patterns emerge. When you understand what your users actually need (and why), you stop guessing and start building with purpose.
Customer insights go beyond surface-level metrics. They reveal behavior patterns, uncover friction points, and highlight what users value most. But seeing them in action makes the concept click. That's why concrete examples matter more than abstract definitions, they show you exactly how to apply insights to your own product strategy.
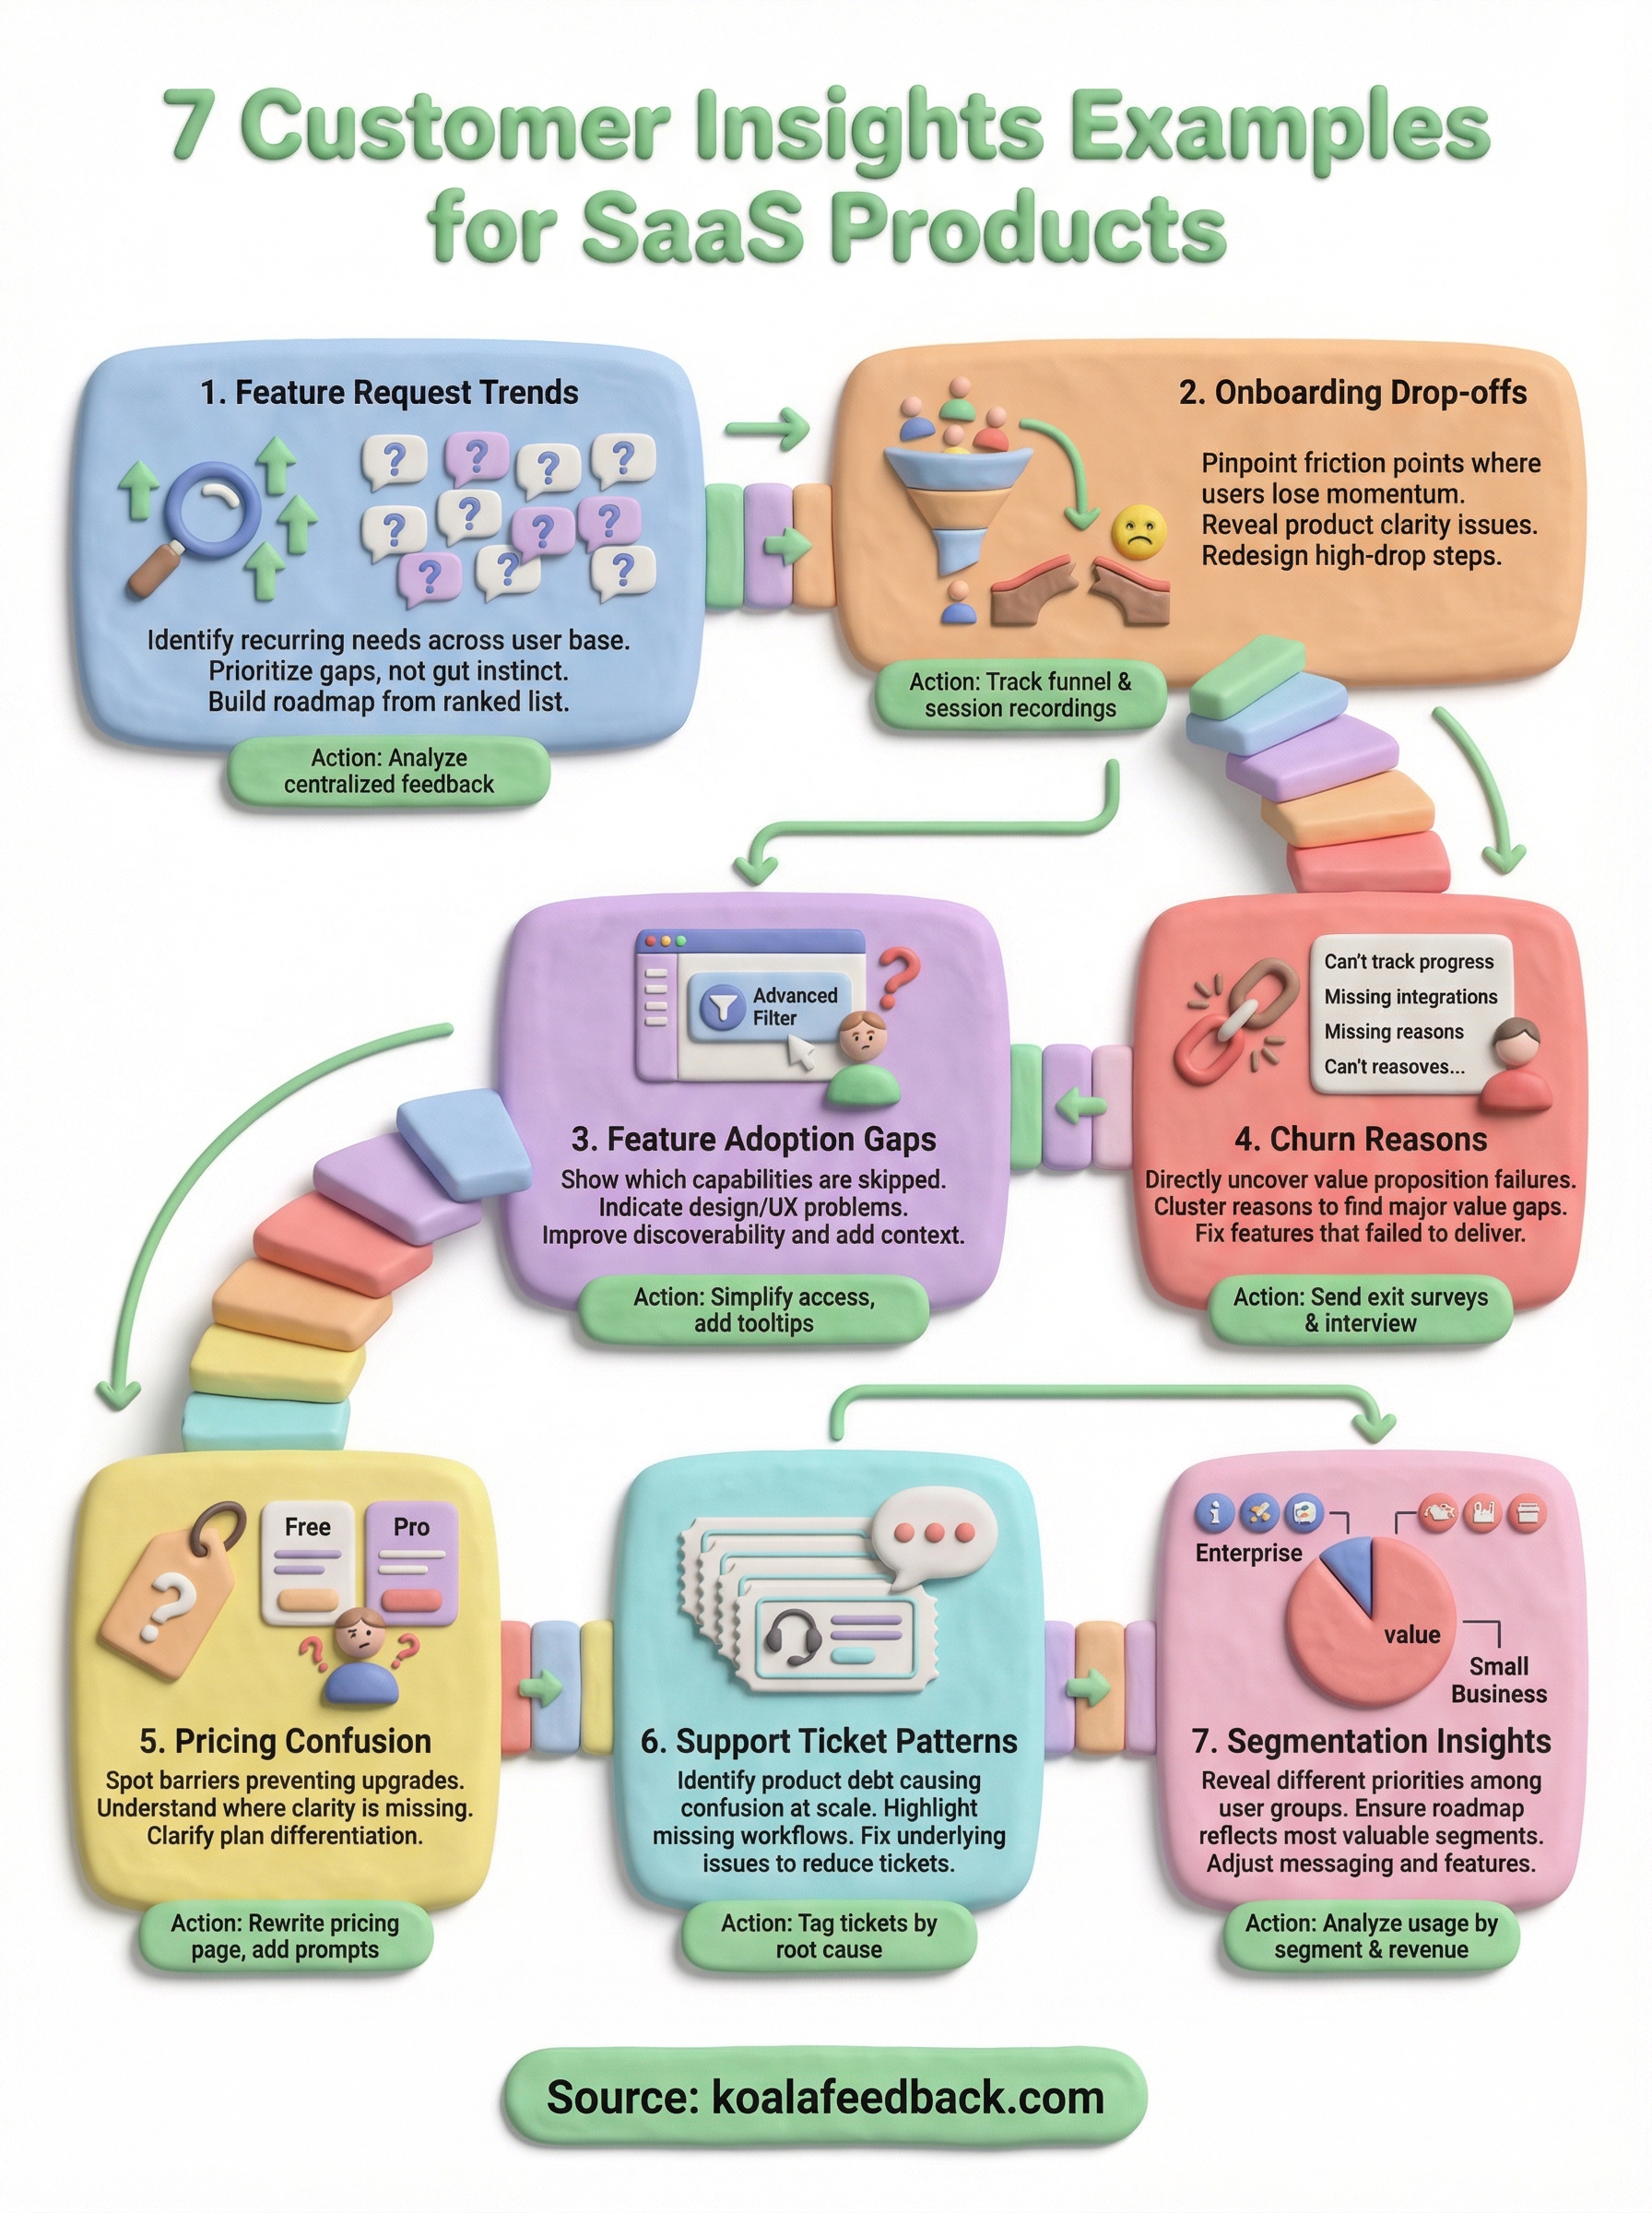
This article breaks down seven practical customer insights examples tailored to SaaS products. Each one is something you can collect, analyze, and act on, especially when you have a centralized feedback system like Koala Feedback to capture and organize what your users are telling you. Let's get into the examples that actually move the needle.
When users repeatedly ask for the same thing, that repetition is the signal. Feature request trends show you which product gaps create the most friction across your user base, and they give you something more reliable than gut instinct to base roadmap decisions on. Tracking these trends over time turns scattered user input into a ranked, actionable list your team can actually work from.
Imagine 40 users request a CSV export feature over three months, while another 15 ask for Slack notifications. Both requests look separate until you notice they share the same underlying need: users want to work with your product data outside the platform. That pattern is one of the clearest customer insights examples you can act on, because it reframes two separate requests into one strategic product decision.
When multiple requests point to the same friction, you're not looking at feature noise. You're looking at a product gap.
Koala Feedback centralizes all incoming requests into a single portal where users submit ideas, vote on existing ones, and leave comments. The voting and deduplication features automatically surface which requests gain the most traction over time. You can review trends by period rather than sorting through individual emails or Slack threads, which makes patterns much easier to spot.
Take your top-requested features and map them against your current roadmap. If a cluster of requests points to a missing workflow, prioritize it and communicate the update publicly through your roadmap. On the marketing side, use the exact language users wrote in their requests to sharpen your copy. They already told you how to describe the problem in terms that resonate with buyers like them.
After shipping a highly-requested feature, track activation rate among the users who voted for it, support ticket volume related to the same use case, and retention rate for that segment. A drop in tickets combined with a lift in retention confirms the feature addressed a real gap, not just a vocal minority.
Low activation rarely means your product is bad. It usually means users hit a specific friction point early on and never recovered. Onboarding drop-offs are one of the most actionable customer insights examples available to SaaS teams because they pinpoint exactly where users lose momentum before they experience your product's core value.
Suppose 60% of new signups complete step one of your onboarding flow but only 20% reach step three. That gap is not random. It signals a specific moment where users stop trusting the setup process or fail to see the next step's value. When you identify that moment, you stop losing users you already paid to acquire.
A drop-off at a specific onboarding step tells you more about your product's clarity than any survey ever will.
Use product analytics tools like Mixpanel or Amplitude to build funnel reports that track each onboarding step individually. Pair this with session recordings so you can watch where users pause, backtrack, or abandon the flow entirely. Exit surveys triggered at drop-off points add qualitative context to the quantitative pattern.
Redesign the step with the highest drop-off rate first. Simplify the ask, reduce required fields, or add inline guidance that clarifies what the user gains by completing it. Your onboarding emails should also address the friction directly by nudging users back to exactly where they stopped.
Track activation rate week-over-week after the redesign, alongside time-to-activate for new cohorts. A shorter time-to-activate paired with a higher percentage reaching your key activation milestone confirms the change worked.
A feature your team shipped can sit unused for months without anyone raising a complaint. Feature adoption gaps show you which capabilities users skip, ignore, or abandon after one try, and that pattern is one of the most underused customer insights examples in SaaS. When users consistently avoid a feature, the problem is rarely awareness. It is almost always friction buried in the design.
Suppose you ship an advanced filter feature for your dashboard, but only 8% of users ever activate it. The other 92% rely on workarounds or miss the value entirely. That gap is not a communication failure. It points to a UX problem that makes the feature harder to find or understand than it should be.
Low adoption on a high-value feature is almost always a design problem, not a marketing problem.
Use feature-level analytics to track which tools users activate versus which ones they open once and drop. Pair that with heatmaps and session recordings to see exactly where users look, click, and stop engaging inside the feature itself.
Reduce the number of steps required to reach the feature and add contextual tooltips that explain the benefit at the moment users need it. Your in-app messaging can also surface the feature at the right point in the user's workflow rather than burying it in a settings menu.
Track feature adoption rate before and after the redesign. Watch time-to-first-use for new signups as a secondary signal that the feature is now discoverable without extra effort.
Churn rarely happens without warning. Users leave because they stopped believing your product solves their problem, and exit data from churned accounts gives you a direct line to that belief breakdown. Among all the customer insights examples available to SaaS teams, churn analysis stands out because it tells you exactly which part of your value proposition failed to land.
Suppose 30% of churned users report they switched because they couldn't track progress on their requests, while another 20% cite a lack of integrations. Both groups stopped seeing value, but they stopped at different moments in the product experience.
When multiple churn reasons cluster around one theme, you have found a value gap that no amount of marketing can fix.
Send a short exit survey immediately after a user cancels, and follow up with a direct call for your highest-value accounts. Ask one focused question: what made you stop using the product? Keep response options broad enough to catch patterns but specific enough to group by theme.
Map the top churn reasons to specific product features or workflows that failed to deliver. Prioritize fixes based on how many users cited the same gap, and update your onboarding flow to surface that value earlier before users reach the point of doubt.
Track monthly churn rate and net revenue retention after each fix. Rising retention among previously high-churn segments confirms you addressed the right gap.
When users want more from your product but can't figure out which plan gives them what they need, they don't upgrade. They leave. Pricing and packaging confusion is one of the most overlooked customer insights examples in SaaS because the signal hides in what users don't do rather than what they say. Understanding where that confusion starts lets you remove the barrier before it costs you revenue.
Suppose 25% of free users visit your pricing page three or more times but never convert. They're interested but uncertain. That repeated visit pattern tells you the page isn't answering the right questions, and that gap between intent and action is a direct sign that your plan differentiation isn't clear enough to trigger a decision.
When users visit your pricing page repeatedly without converting, the page is working against you.
Track pricing page behavior using analytics that log visit frequency, time on page, and scroll depth. Combine that with short in-app surveys asking free users what's stopping them from upgrading. Their answers cluster around missing clarity on features, limits, or value differences between plans.
Rewrite your pricing page to lead with outcomes, not feature lists. Use a simple comparison table that highlights what each plan unlocks. Inside the product, add contextual upgrade prompts at the exact moment users hit a plan limit.
Track free-to-paid conversion rate and average time from signup to first upgrade. A shorter conversion window signals users now understand the value of upgrading without needing multiple visits to decide.
Your support inbox holds some of the most direct customer insights examples you will ever collect, and most teams treat it like a queue to clear rather than data to analyze. When the same issue appears in tickets week after week, that repetition signals product debt: a part of your product that causes confusion at scale and costs your team time every time it does.
Suppose 35% of your support tickets each month ask about the same workflow, such as how to connect two features that users expect to work together automatically. That pattern tells you the product is missing a logical step that users assume exists. The support team fills that gap manually, which means you are paying people to compensate for a product flaw.
When your support team answers the same question repeatedly, your product is the one asking for help.
Tag every incoming ticket by topic and root cause using your helpdesk tool. Review the tag distribution weekly and look for clusters that grow rather than shrink over time.
Prioritize the top recurring ticket category on your next sprint and fix the underlying workflow. Update your in-app guidance to address the confusion before users need to contact support.
Track ticket volume by category and average resolution time after the fix. A sustained drop in that ticket category confirms the product gap is closed.
Not all users need the same thing from your product. Segmentation insights split your user base into groups based on behavior, plan type, company size, or use case, and they reveal that the roadmap your loudest users push for may not reflect what your most valuable segment actually needs.
Suppose your enterprise accounts rarely use the features you've been shipping, while your small-business users request them constantly. You've been building for volume, but your revenue concentration sits in a segment with entirely different priorities. That misalignment is one of the clearest customer insights examples that signals a roadmap recalibration is overdue.
When your highest-revenue segment goes quiet on feature requests, they're not satisfied. They're underserved.
Pull usage data by segment from your analytics platform and cross-reference it with plan type, account size, and revenue contribution. Combine that with targeted surveys sent specifically to each segment to surface what each group values most.
Build separate roadmap views for each major segment and weight feature priority by revenue impact rather than raw vote count. Your messaging should also shift to speak directly to the problems each segment faces instead of using one-size-fits-all positioning.
Track expansion revenue and feature adoption rates broken down by segment. Rising adoption within your highest-value tier confirms your roadmap now reflects the needs of the users who matter most to growth.
The seven customer insights examples in this article share one common thread: they all start with organized, centralized data. If your feedback lives across emails, Slack threads, and spreadsheets, you will always be a step behind. Fixing that foundation is the highest-leverage move you can make before anything else.
Start with one insight type that maps to your biggest current problem. If retention is slipping, begin with churn analysis. If activation is lagging, start with onboarding drop-offs. Pick one, act on it, and measure the result before moving to the next. That focused approach compounds faster than trying to analyze everything at once.
Koala Feedback gives your users a place to submit ideas, vote on requests, and watch your public roadmap evolve in real time, so you always have genuine signal to work from. Set it up, let your users tell you what matters most, and build from there.

Start today and have your feedback portal up and running in minutes.
