Every feature request, support ticket, and product review your users leave behind tells a story. Pieced together, these signals form customer behavior insights, the patterns and motivations behind why people use your product the way they do. Understanding these insights is the difference between guessing what to build next and knowing it.
But raw data alone doesn't get you there. You need a structured way to collect feedback, spot recurring themes, and connect those patterns to real product decisions. That's exactly what we built Koala Feedback to do, give teams a centralized place to capture user input, organize it, and turn it into a clear direction for development. The closer you are to your users' actual behavior and preferences, the sharper your roadmap becomes.
This guide breaks down what customer behavior insights really are, the types of data that fuel them, and concrete examples of how businesses use them to improve their products. Whether you're a product manager sorting through hundreds of requests or a founder trying to find signal in the noise, you'll walk away with a practical framework for collecting and acting on these insights.
When you understand why users behave the way they do, you stop building features based on assumptions and start building based on evidence. Most product failures don't happen because teams lack skill; they happen because teams solve the wrong problems. Customer behavior insights close that gap by grounding every decision in actual user patterns rather than internal opinions or guesswork.
Every sprint your team spends building a feature nobody asked for is time and money you can't recover. Development cycles are expensive, and reversing a product decision after implementation costs even more. When you collect and analyze behavior data systematically, you build a clear picture of what users actually need, not what you assume they need.
The difference between a feature that drives retention and one that gets ignored almost always comes down to whether it was built from user evidence or internal assumption.
Teams that rely on consistent feedback loops ship with more confidence because they've already validated the direction before writing a single line of code. That alignment between user demand and product output shortens development cycles and cuts wasted effort significantly.
Churn rarely announces itself. Most users don't send a cancellation email explaining exactly what went wrong. They quietly stop logging in, downgrade their plan, or switch to a competitor without a word. By the time you notice the drop in your metrics, the window to act has already closed.
Behavioral signals, such as drop-off points in your onboarding flow, features that get clicked once and never revisited, or support tickets repeating the same theme, give you early warning signs you can actually respond to. When you catch these patterns while they're still emerging, you have time to make changes that keep users engaged instead of scrambling to win them back after they've left.
Internal roadmap debates often stall because everyone holds a different opinion about what matters most. One stakeholder wants a new integration, another wants a redesigned dashboard, and a third is pushing for better reporting. Without shared data, those conversations go in circles and slow everything down.
User behavior data gives your team a common reference point that cuts through subjective preference. When you can point to the number of users who requested a feature, the frequency of related support tickets, or the volume of upvotes on a feedback board, prioritization becomes a data exercise instead of a political one. That clarity accelerates decisions and keeps your team aligned around what actually moves the needle for your users.
Not everything you track qualifies. A raw number like "500 users logged in yesterday" is a metric, not an insight. An insight emerges when you combine data points to understand the motivation or pattern behind the behavior. For example, "500 users logged in yesterday, but 80% of them only accessed one feature and left within three minutes" tells you something actionable about where your product may be falling short.
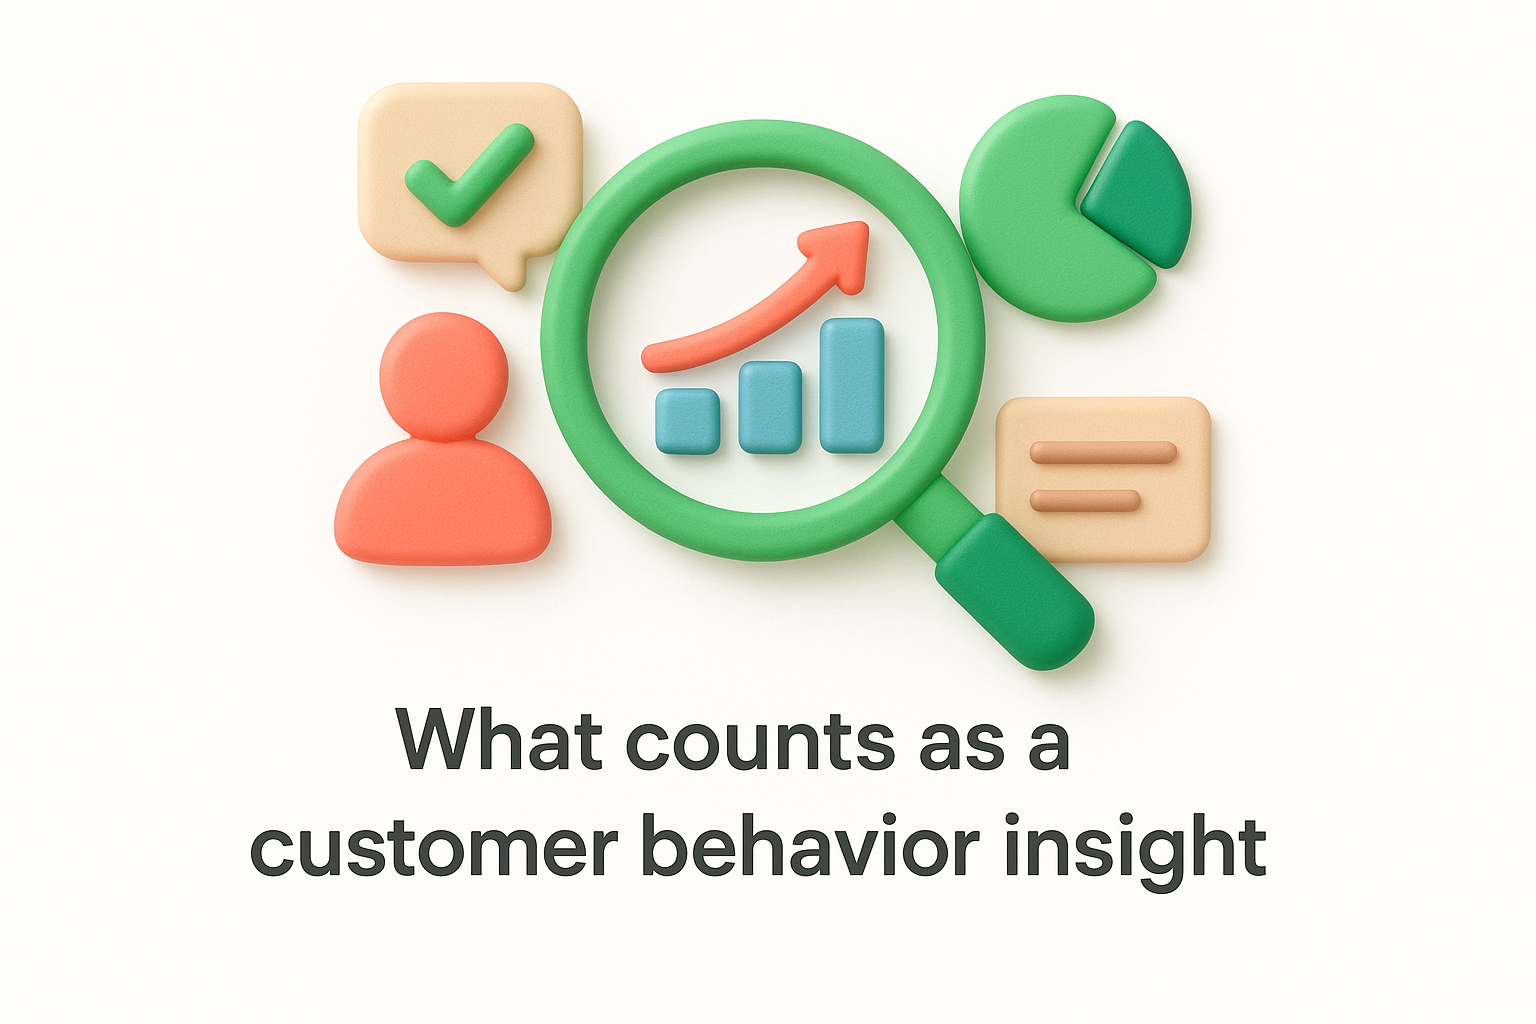
An insight is only useful when it answers "why" or "what should we do differently," not just "what happened."
Customer behavior insights typically fall into two categories: quantitative signals you can count and qualitative signals that explain the meaning behind those numbers.
Quantitative signals are measurable actions users take inside your product or during their interactions with your business. These include click patterns, session duration, feature adoption rates, churn rates, and support ticket volume. These numbers show you where friction exists, which features users gravitate toward, and where people drop off before completing a key action.
Qualitative signals give you the context that numbers alone cannot provide. User interviews, open-ended survey responses, feedback submissions, and comment threads reveal the reasoning behind what users do. When someone votes on a feature request and adds a comment explaining exactly what problem they're trying to solve, that comment is a high-value qualitative signal that no click-tracking tool can surface on its own.
Collecting both signal types gives you a complete picture of your users' actual needs. Quantitative data shows you what is happening; qualitative data explains why it's happening. Together, they form the foundation of meaningful customer behavior insights that drive better, more confident product decisions.
You don't need a massive research operation to gather useful data on your users. What you need is a consistent set of methods that captures both what users do and what they say, so you can build customer behavior insights from real signal rather than internal assumption. The three approaches below give you solid coverage without overwhelming your team.
Product analytics tools record every click, session, and workflow users complete inside your app. Set up event tracking around the actions that matter most, including feature activation, onboarding step completion, and key conversion points. Pay close attention to drop-off rates at each stage. When you identify where users stop progressing, you surface friction that no survey response alone would reveal.
Focus your event tracking on the specific actions tied directly to user value, not on logging every possible interaction.
In-product surveys and open-ended feedback forms give users a direct channel to describe what they're experiencing in their own words. Keep your surveys short and specific. Asking three targeted questions at the right moment in the user journey returns far more useful data than a long form sent once a quarter.
Running lightweight usability sessions also helps. Ask users to walk through a key workflow while thinking aloud, and you'll consistently surface confusion and unmet expectations that click-tracking data cannot show you on its own.
Scattered feedback sitting across email threads, Slack messages, and support tickets makes recurring patterns nearly impossible to spot. A dedicated feedback portal like Koala Feedback gives users one place to submit ideas, vote on existing requests, and add comments explaining their specific use case. This structure removes duplication by consolidating similar requests automatically and builds a ranked, searchable record of user priorities that your entire team can reference when deciding what to build next.
Collecting data is only half the work. Raw numbers and individual feedback submissions don't become customer behavior insights until you apply a structured process to find the patterns connecting them. The goal is to move from "here's what users did or said" to "here's what we should change and why."
A single support ticket about a confusing settings page is noise. Fifteen tickets on the same topic, combined with a high drop-off rate at that same step in your analytics, is a clear signal worth acting on. When you cross-reference your quantitative data with qualitative feedback, recurring themes surface that neither source would reveal on its own. Start by pulling your top feedback submissions alongside your feature usage data and looking for direct overlap between what users request and where your metrics show friction.
The most actionable insights come from the intersection of what users say they want and what your data shows they actually struggle with.
Users often describe solutions rather than problems. Someone might request "a dark mode" when the real issue is eye strain during long sessions. Another user might ask for "a bulk export button" when the underlying problem is a slow, repetitive workflow. When you reframe each request around the core problem it represents, you spot clusters of users sharing the same need even when they're describing it differently. This approach lets you build one well-designed solution that addresses multiple overlapping requests instead of shipping a long list of disconnected features.
Once you've grouped your data by problem theme, rank those themes by frequency and user impact. High-frequency problems affecting your most active or highest-value users should move to the top of your list. That ranking gives your team a defensible, data-backed reason to deprioritize lower-impact work and focus on changes that will actually move your retention and engagement numbers.
The most useful way to understand customer behavior insights is to see them in action. Frameworks only go so far; concrete scenarios show you exactly how to connect what you observe to what you change. The two examples below cover common situations product teams face, and each one maps directly to a decision you can make with data you already have access to.
Your team is debating whether to build a bulk export feature or improve your notification system. Instead of letting the loudest voice in the room decide, you open your feedback board and check the vote count on each request. The export feature has 47 votes and 12 comments describing specific workflow problems; the notification improvement has 8 votes and no comments. That data ends the debate before it wastes another hour of your team's time.
A vote count paired with user comments gives you both the "how many" and the "why," which together make a much stronger case than either signal alone.
Once you resolve the roadmap question, you can also read through the comment threads on the winning request to understand exactly which workflows users are trying to improve. That context shapes how you design the feature, not just whether you build it.
You notice from your analytics that 60% of new users never reach the point where they complete their first meaningful action inside your product. That's not a minor gap; it means most users leave before experiencing any value. You identify the exact step where users stop, run three short interviews to understand the confusion, and discover the step requires information most users don't have on hand during signup.
You reorder the flow to make that step optional, and your activation rate improves within two weeks. The fix cost your team one day of work because the data told you exactly where to look, and the interviews told you exactly what to change.
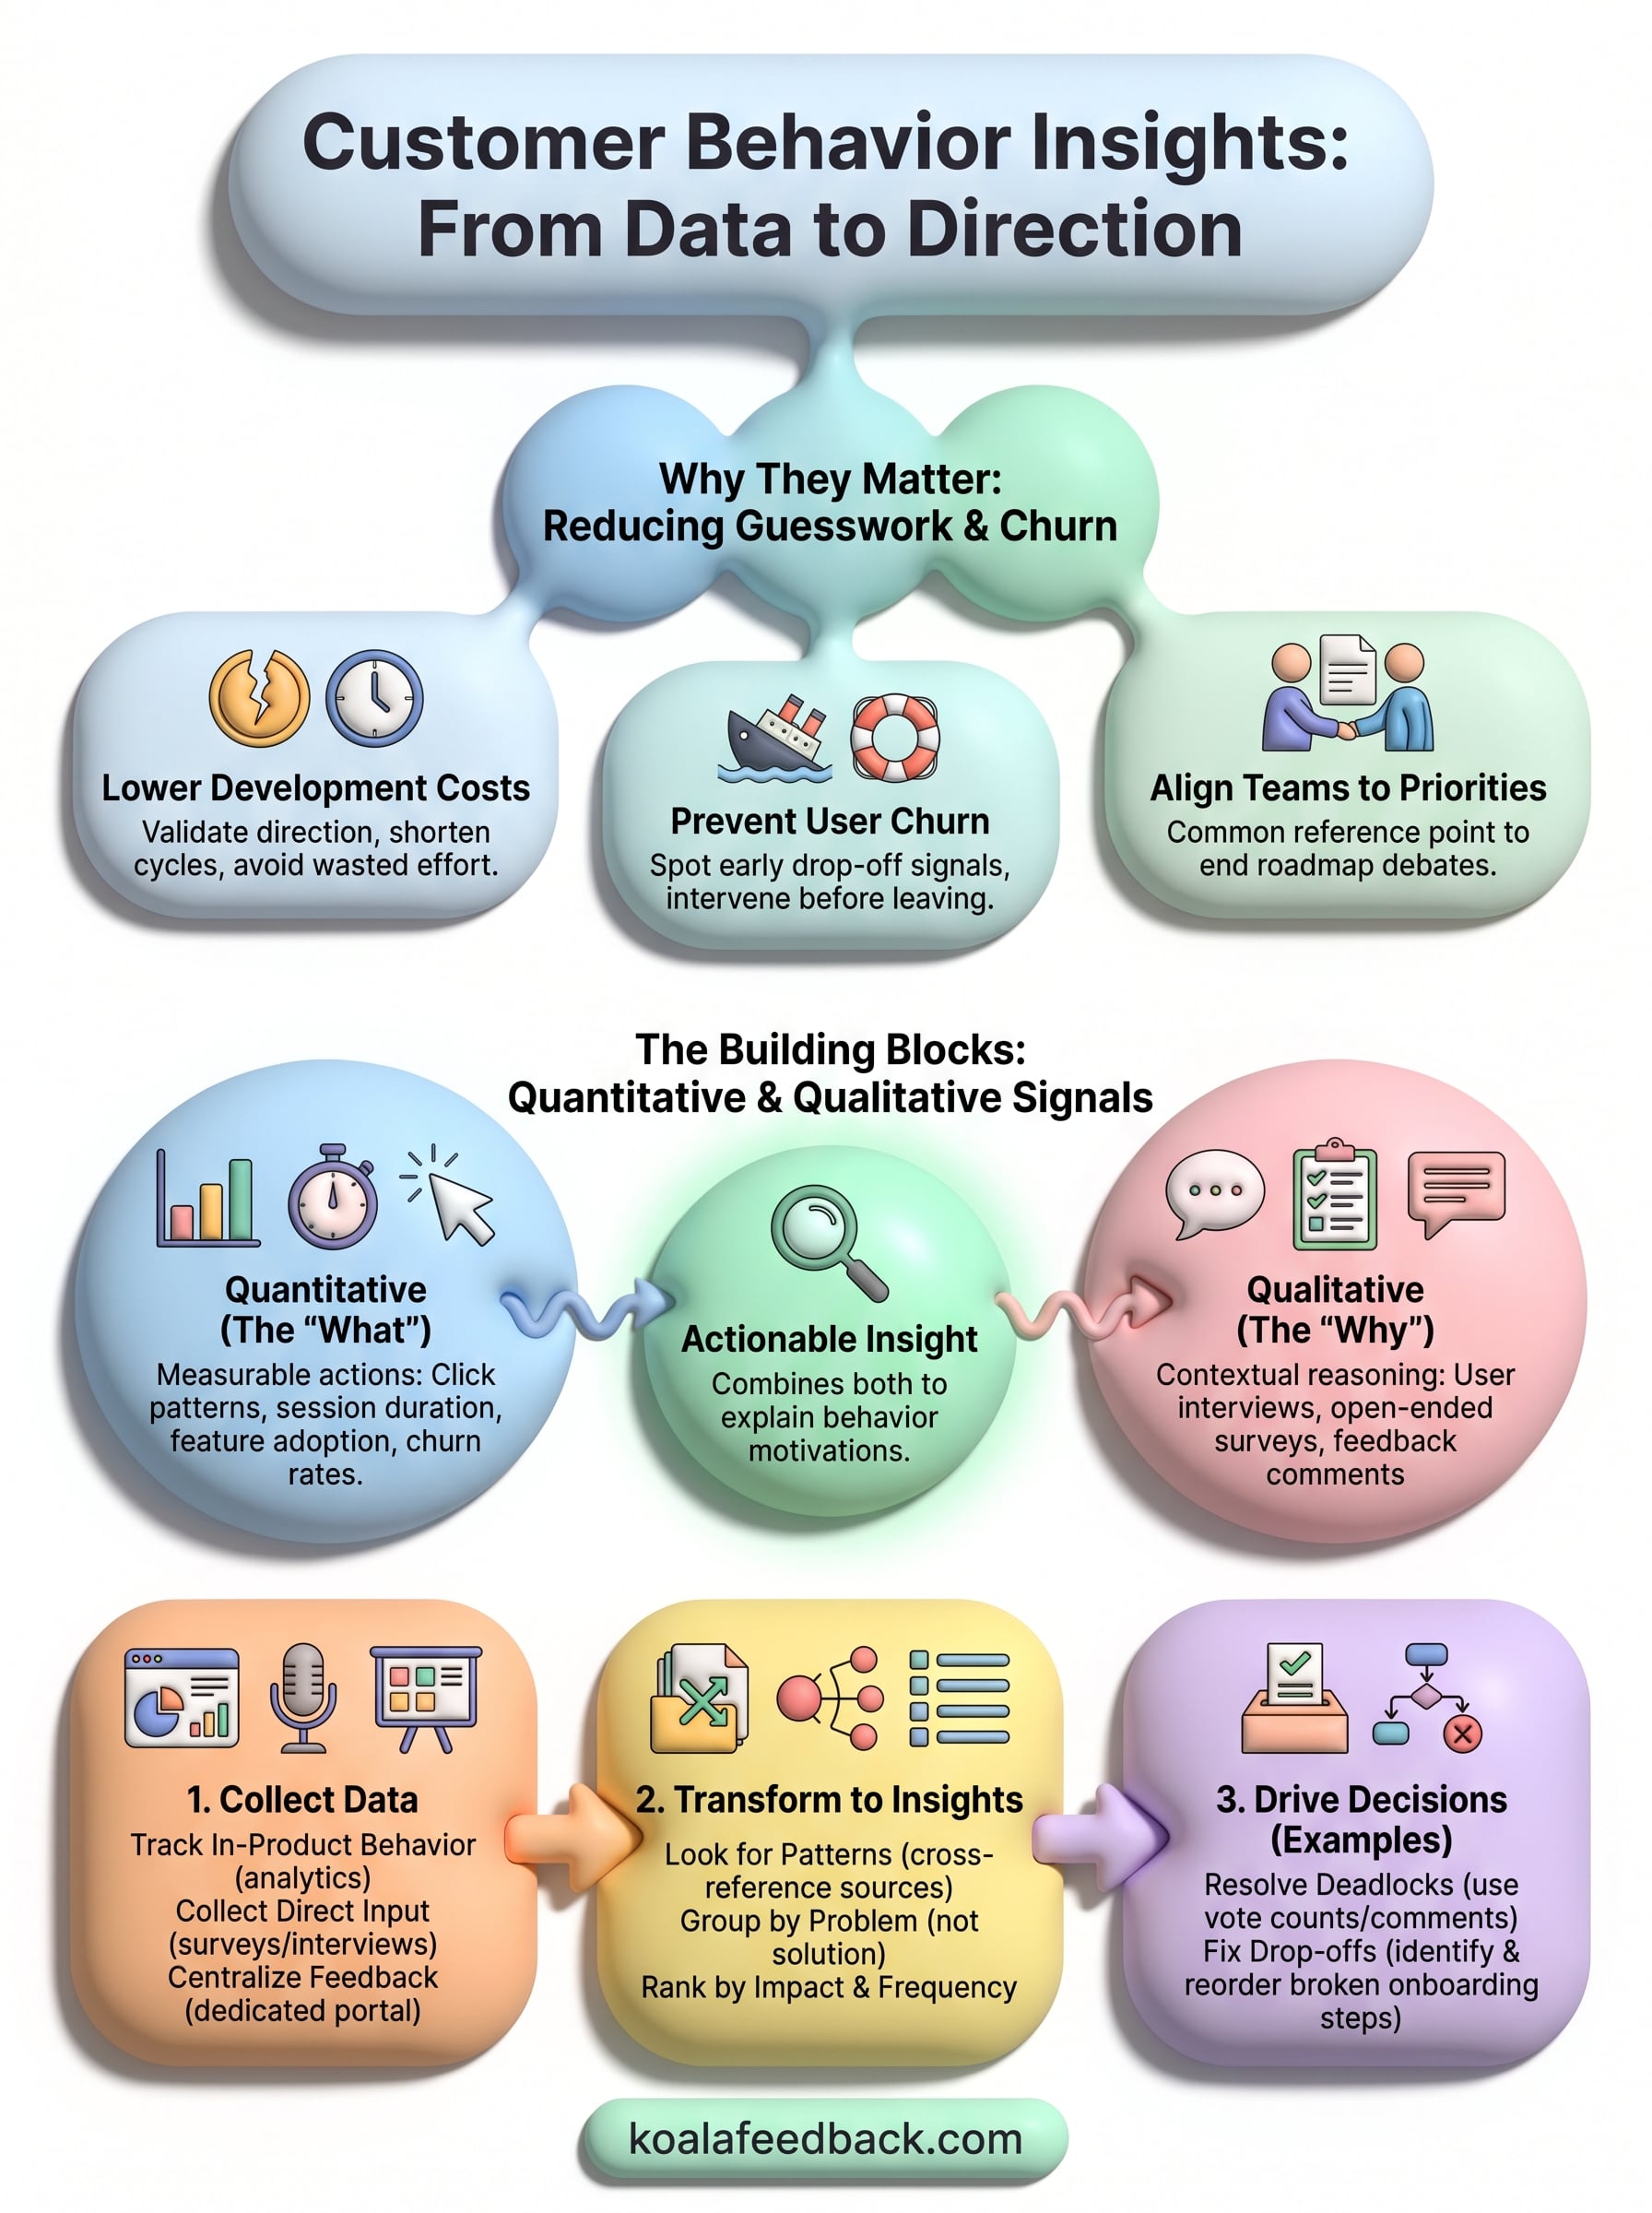
Customer behavior insights don't require a research team or a complex data stack to get started. You need a repeatable process: collect feedback from real users, track where they struggle inside your product, and connect those two sources to find the patterns worth acting on. The examples in this guide all follow that same loop, and each one starts with having a reliable place to capture user input.
The biggest obstacle most teams face isn't a lack of data; it's data spread across too many places to spot recurring themes. When feedback lives in one organized system, prioritization becomes straightforward and your entire team works from the same picture of user needs. That's exactly what Koala Feedback is built to solve. If you're ready to bring structure to your feedback process and build a roadmap your users actually trust, start collecting feedback with Koala Feedback and see how quickly patterns emerge.

Start today and have your feedback portal up and running in minutes.