If a customer has to fight through three support tickets just to cancel a subscription or fix a billing error, you already know how that story ends. Customer effort score explained simply: it's the metric that tells you how much work customers had to do to get something done with your product, and high effort is one of the fastest ways to lose them for good.
CES asks one direct question after a support interaction or task, usually something like "how easy was it to resolve your issue," scored on a simple scale. Unlike NPS, which measures loyalty, or CSAT, which measures satisfaction with a moment, CES measures friction. Low effort scores correlate strongly with repeat purchases and renewals, which makes this metric one of the best predictors of churn you can track.
In this article, you'll get a full breakdown of what CES actually measures, the exact formula for calculating it, and how to run a survey that gets honest answers. We'll also compare CES against CSAT and NPS so you know which metric fits which moment in the customer journey, and show how feeding this data into a tool like Koala Feedback turns raw scores into features worth building.
Research from the original CES study, published by CEB (now Gartner) in Harvard Business Review, found that 73% of customers who reported low effort said they'd buy from that company again, compared to just 4% of customers who reported high effort. That gap is the entire reason product teams track this number. You can read the original findings in Harvard Business Review's breakdown of the research, and the conclusion holds up a decade later: effort predicts loyalty far better than satisfaction does.
Satisfaction surveys ask customers how they feel in the moment, but feelings fade. Effort sticks. A customer who spends twenty minutes hunting for a cancellation link, or who has to explain their billing issue to three different support agents, remembers that frustration long after the interaction ends. That memory shapes whether they renew, whether they recommend you, and whether they quietly start shopping for alternatives. Tracking a customer effort score gives you a concrete number tied to that memory instead of guessing at it.
Low effort keeps customers quiet and loyal; high effort makes them loud, then gone.
High-effort experiences don't just cost you the sale in front of you. They spread. Unhappy customers tell more people about bad experiences than happy customers tell about good ones, and support tickets tied to repeat contact eat into your team's time and budget. Here's what typically shows up when effort scores are ignored:
Each of these is measurable, and each one gets worse the longer high-effort moments go unaddressed.
Most churn metrics tell you what already happened. A customer effort score survey, sent right after a support ticket closes or a task completes, tells you what's about to happen. If effort scores spike after a specific workflow, like password resets or invoice downloads, you know exactly where to intervene before that friction turns into a cancellation. This is what makes CES more actionable than most experience metrics: it points to a specific moment, not a general mood.
Business teams that pair CES with product feedback tools get even more value from it, because low-effort scores often trace back to missing features or confusing workflows that customers have already been asking to fix. Instead of treating a bad CES score as a one-off complaint, you can connect it to a pattern in your feedback backlog and prioritize the fix accordingly. That connection between friction and feature requests is where CES stops being a dashboard number and starts shaping your roadmap.
Measuring CES starts with a single survey question sent immediately after a customer completes a task, resolves a support ticket, or finishes onboarding. You're not asking how they feel about your brand overall; you're asking how much work that specific interaction required. Getting this right means locking down two things: the scale you use and the exact moment you send it, since both affect how honest and useful the responses turn out to be.
Most teams use either a 5-point or 7-point Likert scale, with 1 meaning "very difficult" and the top number meaning "very easy." Some companies swap the wording to a straight agree/disagree format, like "the company made it easy for me to handle my issue," scored from strongly disagree to strongly agree. Either version works as long as you stay consistent across every survey you send, since mixing scales makes historical comparisons meaningless.
| Scale type | Format | Best for |
|---|---|---|
| 5-point | Very difficult to Very easy | Quick post-interaction surveys |
| 7-point | Very difficult to Very easy, finer granularity | Teams tracking small shifts over time |
| Agree/disagree | Strongly disagree to Strongly agree | Statement-based CES questions |
Once responses come in, the calculation itself is simple math. You add up all the scores, divide by the number of respondents, and you get your average CES.
CES = (Sum of all effort scores) / (Total number of responses)
Some teams prefer a percentage-based version instead, counting only the customers who rated their experience 6 or 7 on a 7-point scale, then dividing that count by total respondents. Both approaches are valid; pick whichever one your team finds easier to track on a dashboard and report on month over month.
A single low-effort interaction rarely matters, but a consistent average below your target score is a signal to investigate immediately.
Timing determines whether your data reflects reality. Send the survey within minutes of a support ticket closing, a self-service task finishing, or a purchase completing, while the effort is still fresh in the customer's memory. Waiting days introduces memory bias and drags your response rate down. Automating this trigger through your help desk or in-app messaging tool removes the guesswork and keeps your sample size high enough to trust the number you're calculating.
Every customer experience program eventually asks the same question: which metric actually tells you something useful? CES, CSAT, and NPS all sound similar on paper, but they measure completely different moments in the customer relationship, and mixing them up leads to the wrong fixes. Understanding customer effort score explained alongside its two closest relatives makes it obvious why most mature product teams track all three instead of picking just one.
CSAT captures a snapshot of satisfaction right after a single interaction, like a support chat or a checkout flow. NPS zooms out to measure overall loyalty, asking whether a customer would recommend you to a friend or colleague. CES sits in between, focused entirely on friction during a specific task. A customer can be satisfied with a support agent's friendliness while still reporting high effort because the fix took four separate steps. That distinction is why relying on CSAT alone often misses the real problem.
Satisfaction tells you how a customer felt; effort tells you what actually went wrong.
Timing and purpose separate these three metrics more than the numbers themselves do. Send CES right after a task or ticket closes, send CSAT after any discrete interaction you want feedback on, and send NPS periodically, maybe quarterly, to track the broader relationship. Running all three gives you a fuller picture: NPS tells you if churn risk is rising, CSAT tells you where satisfaction dips, and CES tells you exactly which workflow is causing customers to struggle.
| Metric | What it measures | Typical timing | Sample question |
|---|---|---|---|
| CES | Effort required to complete a task | Immediately after support ticket or task | "How easy was it to resolve your issue?" |
| CSAT | Satisfaction with a specific interaction | Right after that interaction | "How satisfied were you with this experience?" |
| NPS | Overall loyalty and likelihood to recommend | Periodically, quarterly or biannually | "How likely are you to recommend us to a friend?" |
Overlap between these metrics is normal and expected. A low CES score often shows up alongside a dip in CSAT, since a difficult task rarely feels satisfying, and repeated friction eventually drags NPS down too. Product teams that watch all three together catch problems earlier than teams relying on a single dashboard number, because each metric flags a different stage of the same underlying issue before it turns into a lost customer.
Getting the wording right matters more than most teams expect. A poorly phrased CES survey question can nudge respondents toward a middle answer, which flattens your data and hides the exact friction points you're trying to find. The goal is a question so direct that a customer can answer it in five seconds without rereading it.
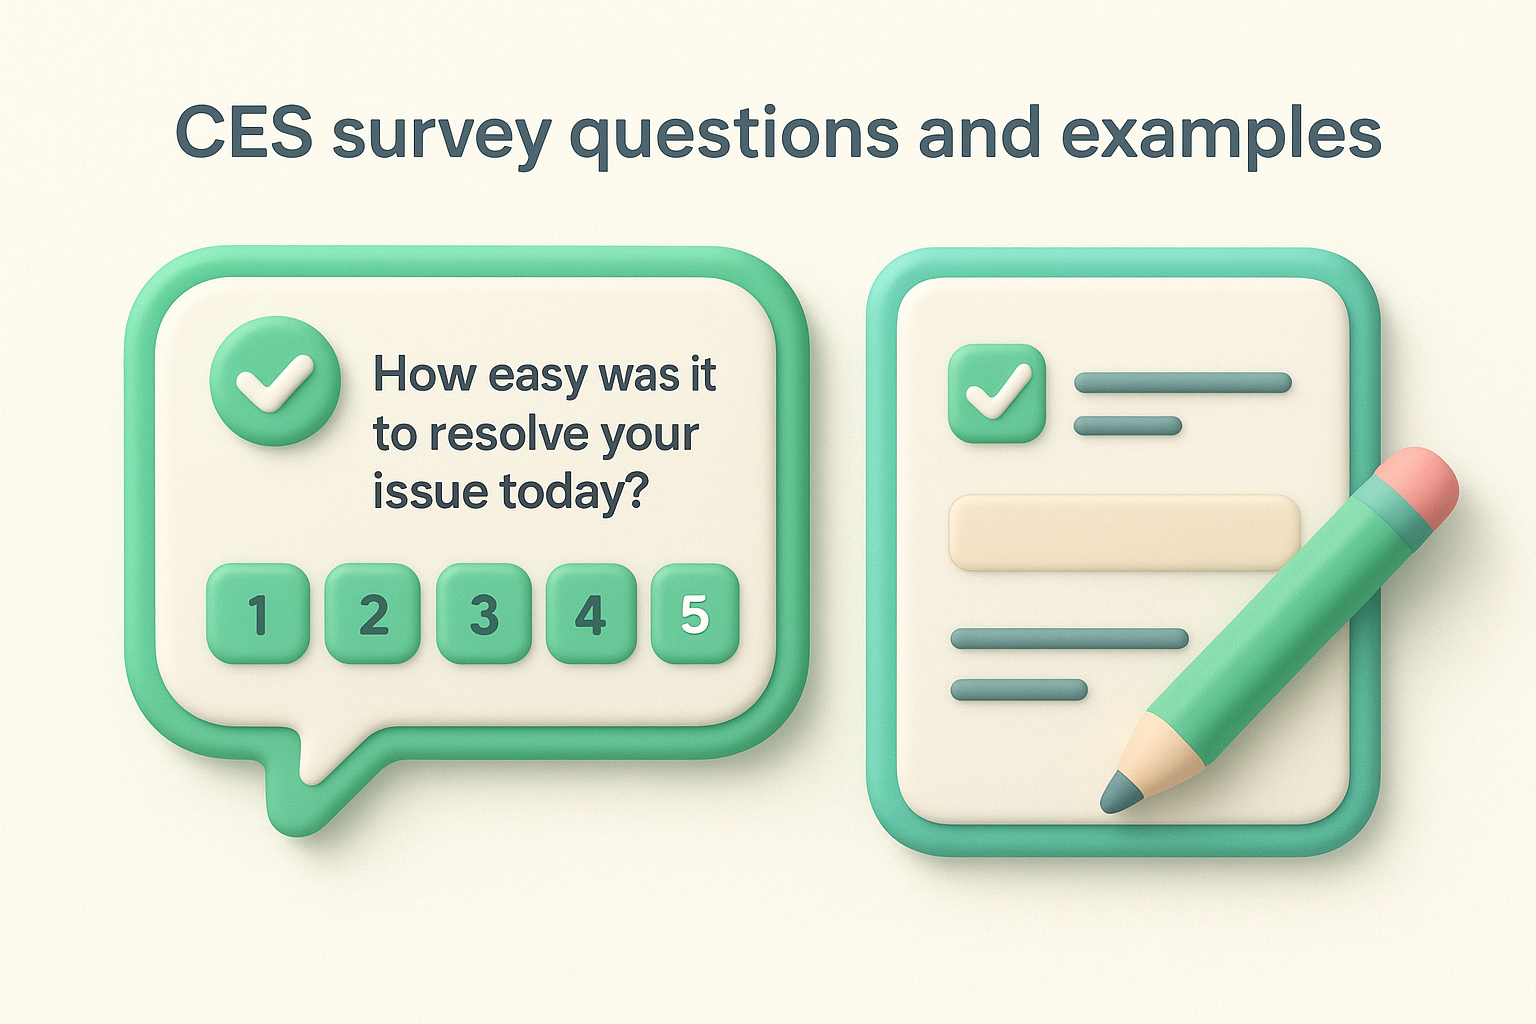
Most effective surveys stick to one of two proven formats: a direct ease-of-use question or an agree/disagree statement. Both work, but consistency matters more than which one you pick, since switching formats mid-campaign makes trend data unreliable.
The best CES questions ask about one specific task, not the whole relationship.
Numbers alone tell you something's wrong, but they rarely tell you what. Pairing your customer effort score question with a single open-text follow-up, like "what made this harder than it needed to be," turns a bare score into a specific, actionable complaint. Skip multiple follow-up fields here. One open box after the rating gets far higher completion rates than a longer form, and you'll get more honest, specific answers because the customer isn't being asked to fill out a full survey after they just wanted to finish a task.
Here's a simple template you can adapt for a support ticket close or task completion trigger:
Subject: Quick question about your recent [support ticket/task]

How easy was it to resolve your issue today?
1 - Very difficult
2
3
4
5 - Very easy

Optional: What made this harder than it needed to be?
[open text field]
Keep the survey to these two fields. Adding demographic questions or unrelated satisfaction ratings drags down response rates and blurs what you're actually measuring. Once responses start coming in, route the open-text answers into your feedback backlog. Patterns in that free text, like repeated mentions of a confusing settings page or a missing self-service option, often line up directly with feature requests customers have already submitted elsewhere, which makes prioritizing the fix a much easier call.
Scoring CES is only useful if you act on what it tells you. Once you've identified where effort spikes, the fix is almost never a training issue with your support team; it's a workflow issue with your product. Reducing customer effort means removing steps, not adding empathy scripts, and the teams that treat it that way see their scores move fastest.
Start with the workflows tied to your lowest scores, whether that's cancellation, billing disputes, or password resets, and count how many steps a customer actually takes to finish each one. Most high-effort tasks share the same problems: too many clicks, unclear next steps, or a handoff between departments that forces the customer to repeat themselves. A few fixes consistently move the needle:
Each change should map back to a specific low-scoring workflow, not a general cleanup pass, or you'll spend effort fixing things customers never complained about.
Open-text responses from your CES survey are the fastest route to root cause, since customers usually tell you exactly what tripped them up if you ask. Feed those comments into a product feedback tool where they can be grouped alongside existing feature requests, because a recurring complaint about a confusing settings page is often the same friction point users have already flagged as a request to simplify that page. Koala Feedback's categorization makes this connection visible instead of buried across separate spreadsheets, so a low CES score on a specific task turns into a prioritized item on your roadmap rather than a stat nobody revisits.
Fixing effort scores means shortening the path, not softening the message.
Gauge whether your fixes actually worked by comparing CES for the same workflow before and after the change, not your company-wide average, which moves too slowly to show a single fix's impact. Improvement shows up fastest in the workflows you targeted directly:
| Workflow | Before fix | After fix |
|---|---|---|
| Cancellation flow | 3.2 avg | 4.6 avg |
| Billing dispute resolution | 2.8 avg | 4.1 avg |
| Password reset | 3.9 avg | 5.0 avg |
Hold each fix to its own before-and-after comparison, and you'll know within a survey cycle or two whether the change actually reduced friction or just moved it somewhere else.
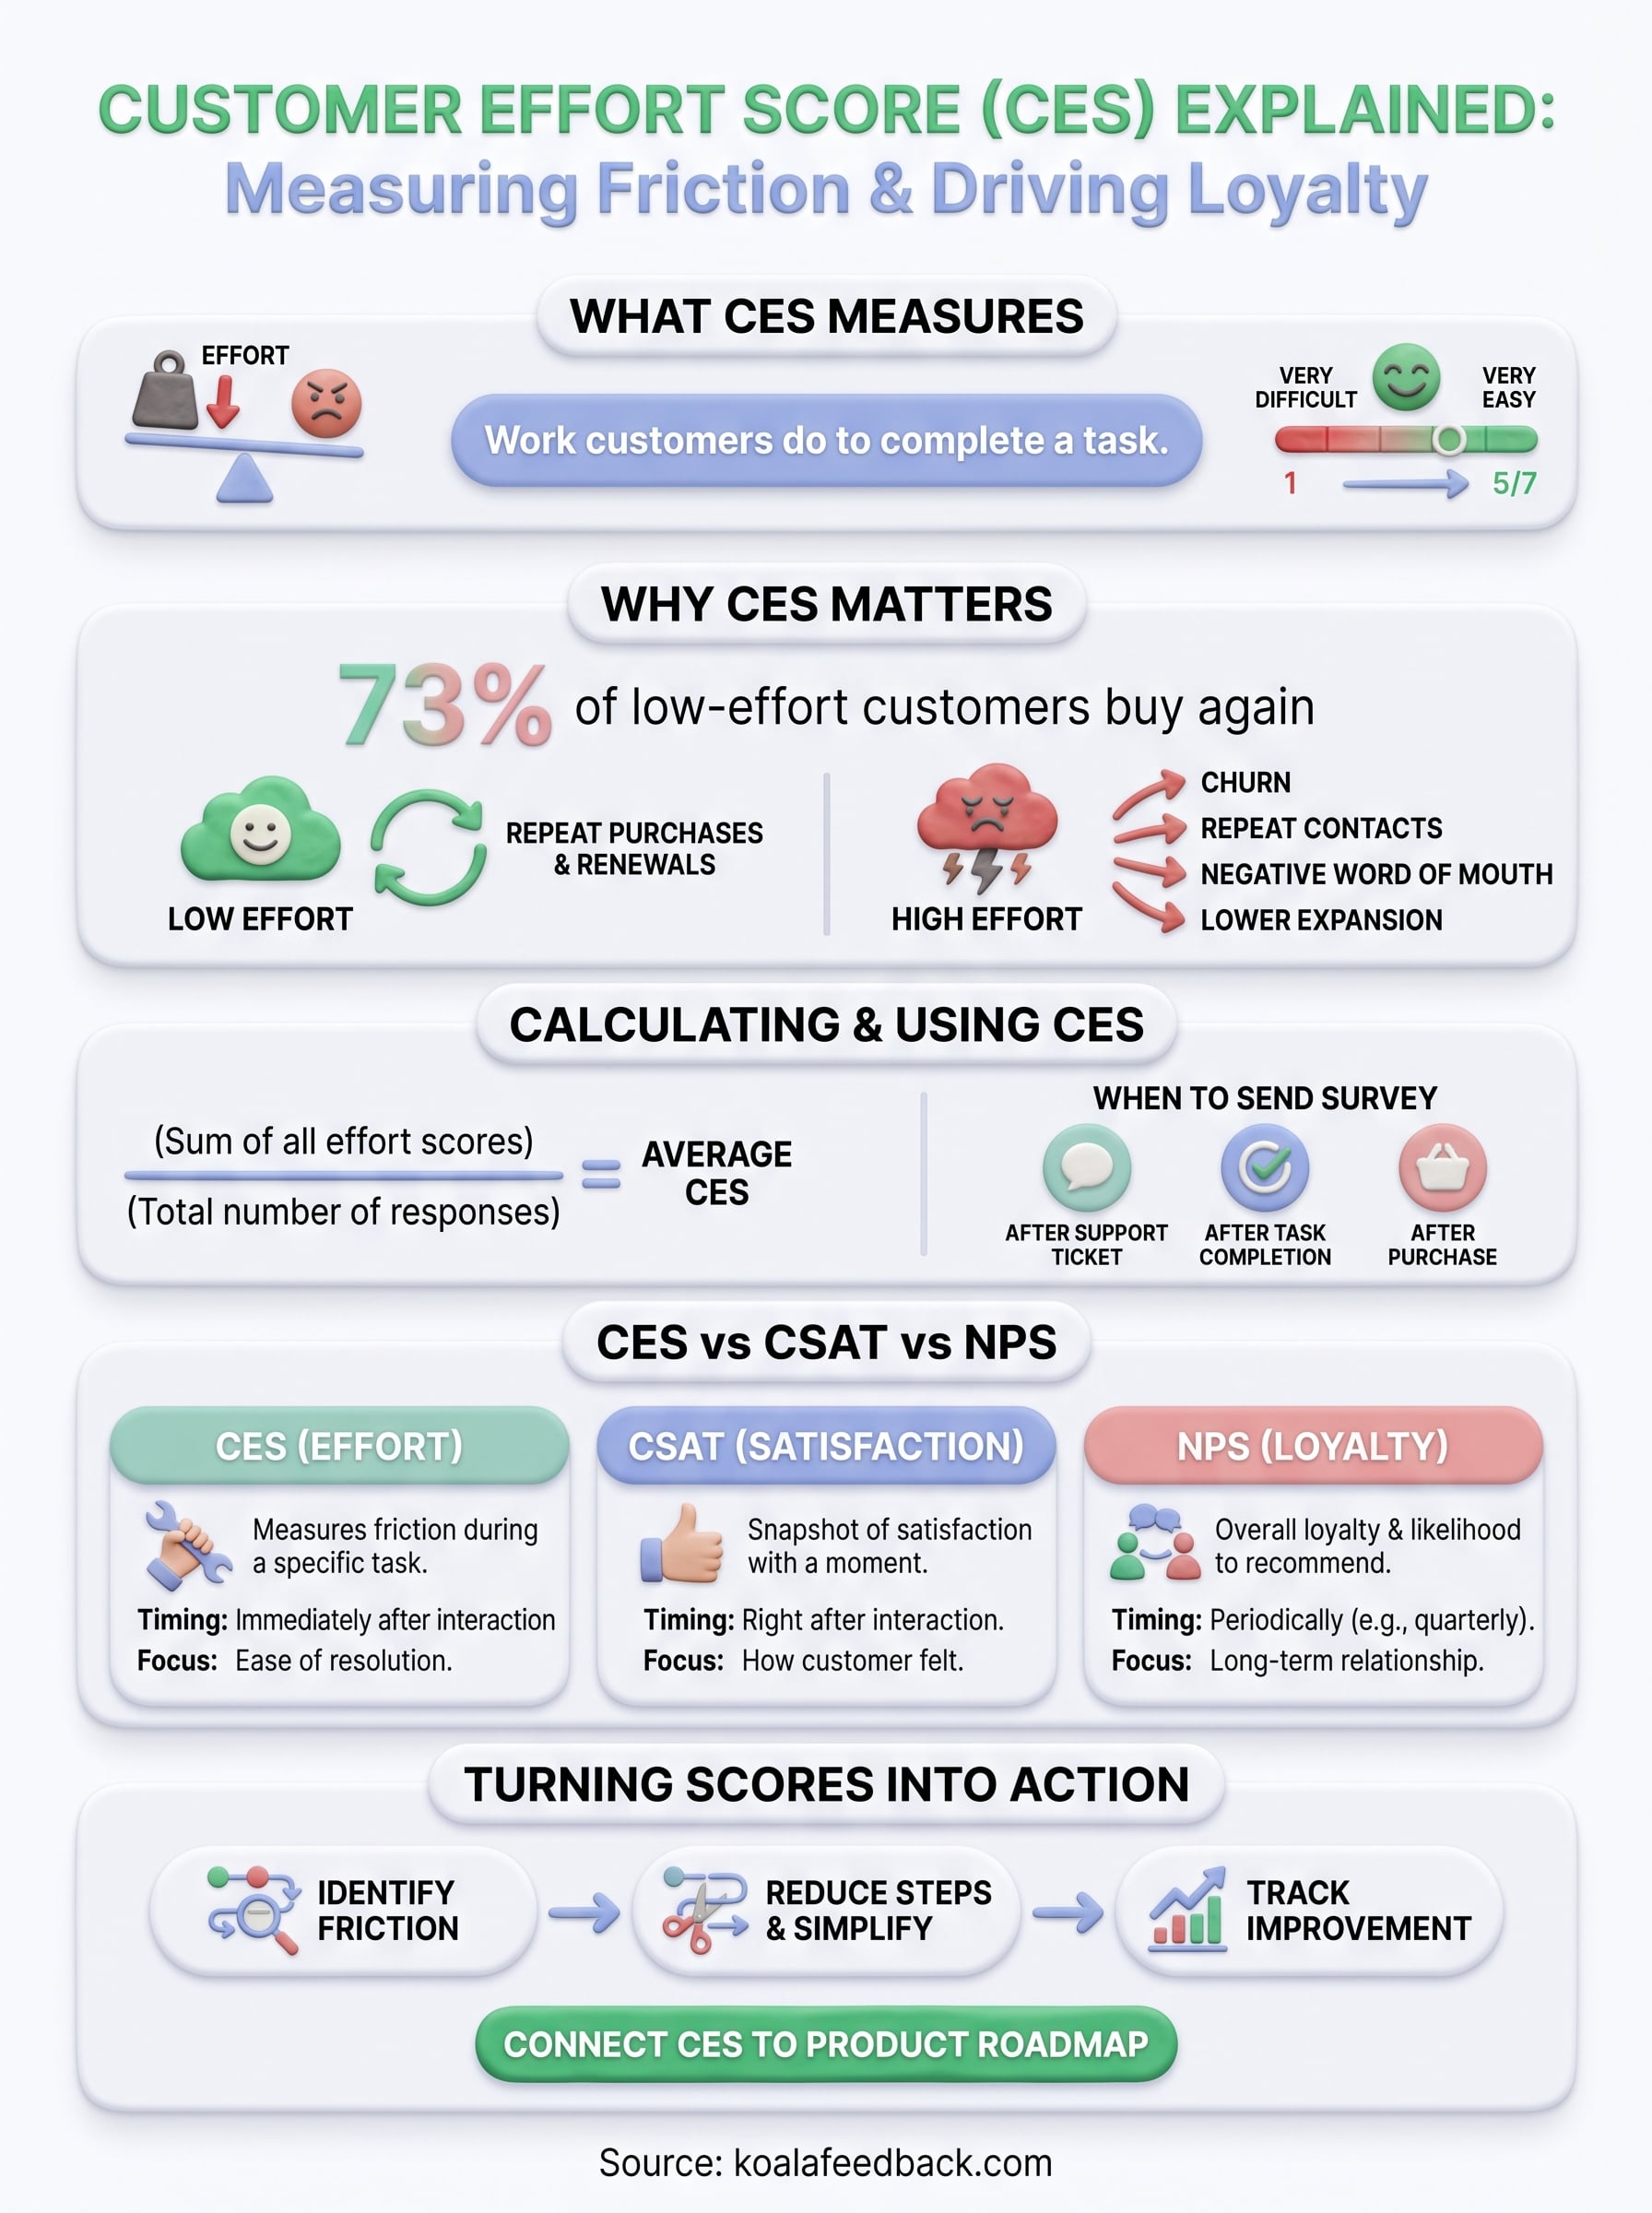
Customer effort score explained in one line: it's the number that tells you where your product is making people work too hard, and it's one of the clearest predictors of churn you have. You now know how to calculate it, which questions get honest answers, and how it stacks up against CSAT and NPS. The real payoff comes when you stop treating CES as a dashboard stat and start routing it into decisions about what to build next.
Scores and open-text comments only matter if they change your roadmap. Every low-effort complaint is a feature request in disguise, and grouping those signals with the requests customers already submitted turns a vague frustration into a prioritized fix. Instead of chasing spreadsheets, use a centralized feedback system built for exactly this. Try Koala Feedback and turn your next CES dip into your next roadmap win.

Start today and have your feedback portal up and running in minutes.