Your customers just filled out a satisfaction survey. Now you're staring at a spreadsheet full of responses, trying to figure out what the numbers actually mean. Knowing how to calculate CSAT score correctly is the difference between guessing how your customers feel and making product decisions backed by real data.
The formula itself is straightforward, but the details matter. Which responses count as "satisfied"? How do you handle a 5-point scale versus a 7-point scale? What's a good score for your industry? These are the questions that trip people up, and getting them wrong skews your entire understanding of customer sentiment.
At Koala Feedback, we help product teams collect, organize, and act on user feedback. CSAT is one of the most common metrics our users track alongside feature requests and roadmap updates, so we've seen firsthand how proper measurement shapes better products.
This guide covers the CSAT formula step by step, shows you how to calculate it in Excel, breaks down benchmarks by industry, and explains how to interpret your results so they actually drive improvements.
CSAT gives you a direct line to how customers feel about specific interactions, features, or support experiences. Unlike broader metrics like Net Promoter Score, which measures overall loyalty, CSAT captures satisfaction at a single point in time, right after a transaction, a support ticket, or a product update. That immediacy makes it uniquely actionable. When you know what triggered a drop in satisfaction, you can address it before it compounds into churn.
Product managers use CSAT to validate whether a new feature actually improved the experience or just added complexity. If you ship an update and CSAT drops in the following week, you have a clear signal that something went wrong. Tracking CSAT scores over time reveals patterns that a single survey cannot, including which releases hurt satisfaction, which improvements resonated, and where friction keeps reappearing. Relying on gut feel or raw feature request volume alone is far less reliable than having satisfaction data tied directly to your release history.
When CSAT is connected directly to product releases, it becomes a feedback loop that keeps your roadmap grounded in real user experience rather than internal assumptions.
Feature prioritization also sharpens significantly when you combine CSAT data with user feedback. If a low CSAT score appears consistently around the same part of your product, you know exactly where to focus next. Teams that ignore this metric often build features users want in theory but that continue to frustrate them in practice.
Support teams rely on CSAT to evaluate the quality of individual interactions and overall team performance. Post-ticket surveys are the most common setup, where customers rate their experience immediately after a support conversation closes. This gives managers concrete data on which agents resolve issues effectively and which need additional coaching.
Knowing how to calculate CSAT score consistently across your support channels also helps you spot systemic problems. If email support scores drop while chat scores stay high, that signals a process gap in one channel rather than an agent-specific issue. You can then retrain, restructure, or change workflows with confidence instead of guessing at the root cause.
Measuring satisfaction consistently over time also sets a concrete baseline for improvement. Without it, you compare subjective impressions quarter to quarter. With it, you have numbers that either confirm progress or tell you exactly where to change course.
The CSAT formula is simple, but applying it correctly depends on knowing which responses count as "satisfied." Getting this step wrong inflates or deflates your score and leads you to draw the wrong conclusions from your survey data. Understanding how to calculate CSAT score starts with one clear equation before anything else.
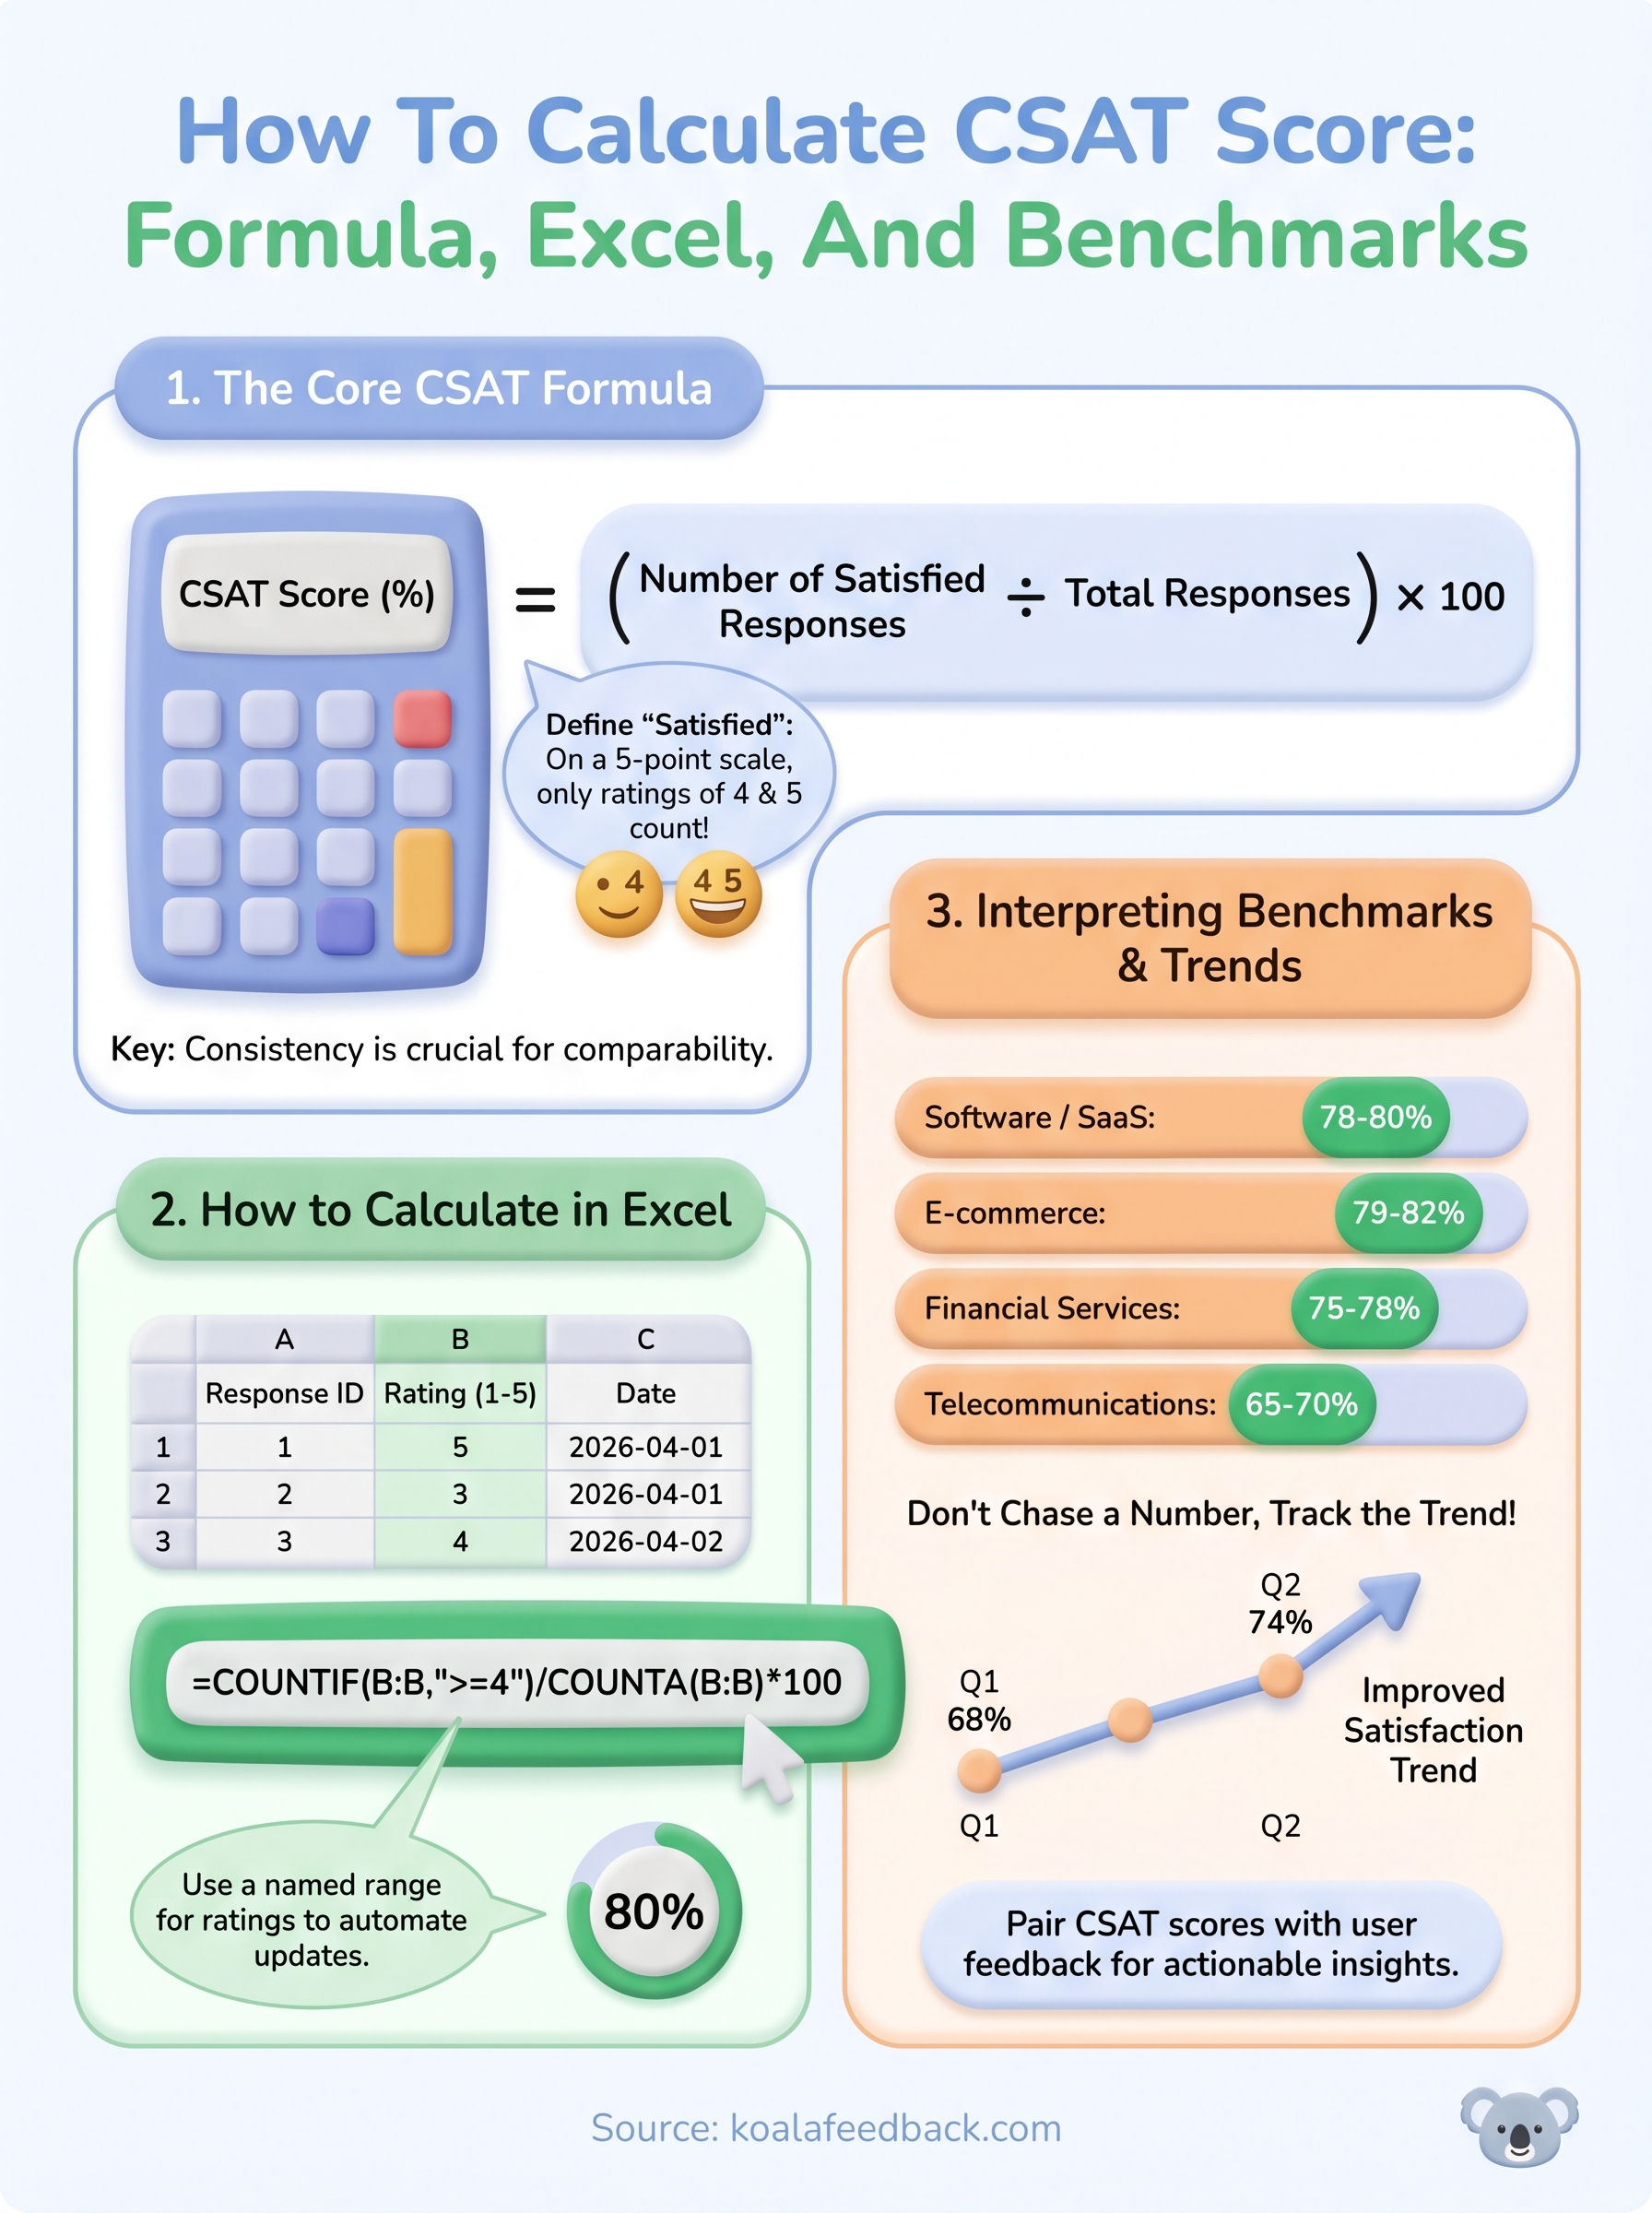
CSAT score equals the number of satisfied responses divided by the total number of responses, multiplied by 100 to express the result as a percentage:
CSAT Score (%) = (Number of Satisfied Responses ÷ Total Responses) × 100
Defining what counts as "satisfied" before you run any calculation is the most important step, because changing that threshold later makes your scores incomparable over time.
On a 5-point scale (1 to 5), only responses of 4 and 5 qualify as satisfied. On a 3-point scale, only the top option counts. On a 7-point scale, responses of 6 and 7 typically meet the threshold. Set your cutoff once and keep it consistent across every survey you run.
Working through a real dataset takes less than five minutes once you know the process. Follow these steps in order:
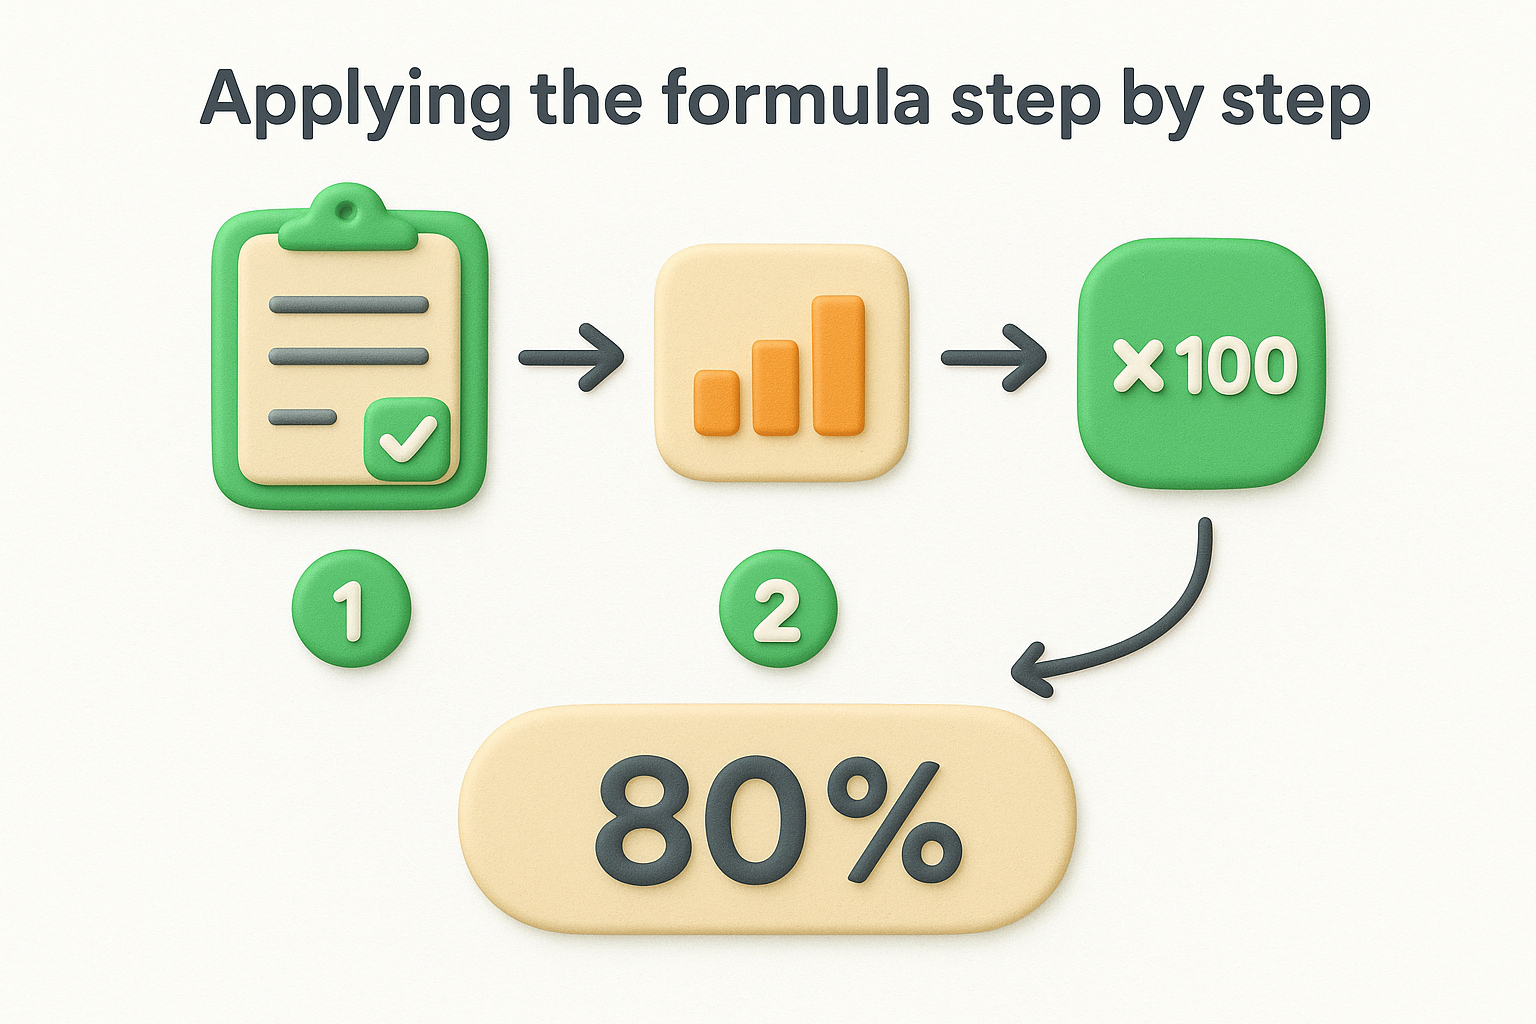
For example, if 80 out of 100 respondents gave you a 4 or 5, your CSAT score is 80%. That number becomes your baseline for tracking improvement over time.
Excel gives you a fast, flexible way to track CSAT over time without specialized software. Once your survey responses are in a spreadsheet, a few simple formulas handle the entire calculation, and you can build a live dashboard that updates automatically as new data comes in.
Start by organizing your data cleanly before writing any formula. Each row should represent one survey response, and your satisfaction ratings should sit in a dedicated column. A basic structure that works well looks like this:
| Column A | Column B | Column C |
|---|---|---|
| Response ID | Rating (1-5) | Date |
| 1 | 5 | 2026-04-01 |
| 2 | 3 | 2026-04-01 |
| 3 | 4 | 2026-04-02 |
Keeping dates in a separate column lets you filter by time period later, which is essential for tracking satisfaction trends across product releases or support periods.
Once your data is structured, learning how to calculate CSAT score in Excel comes down to two functions: COUNTIF and COUNTA. COUNTIF counts responses that meet your satisfied threshold, while COUNTA counts all non-empty cells in the ratings column to give you the total response number.
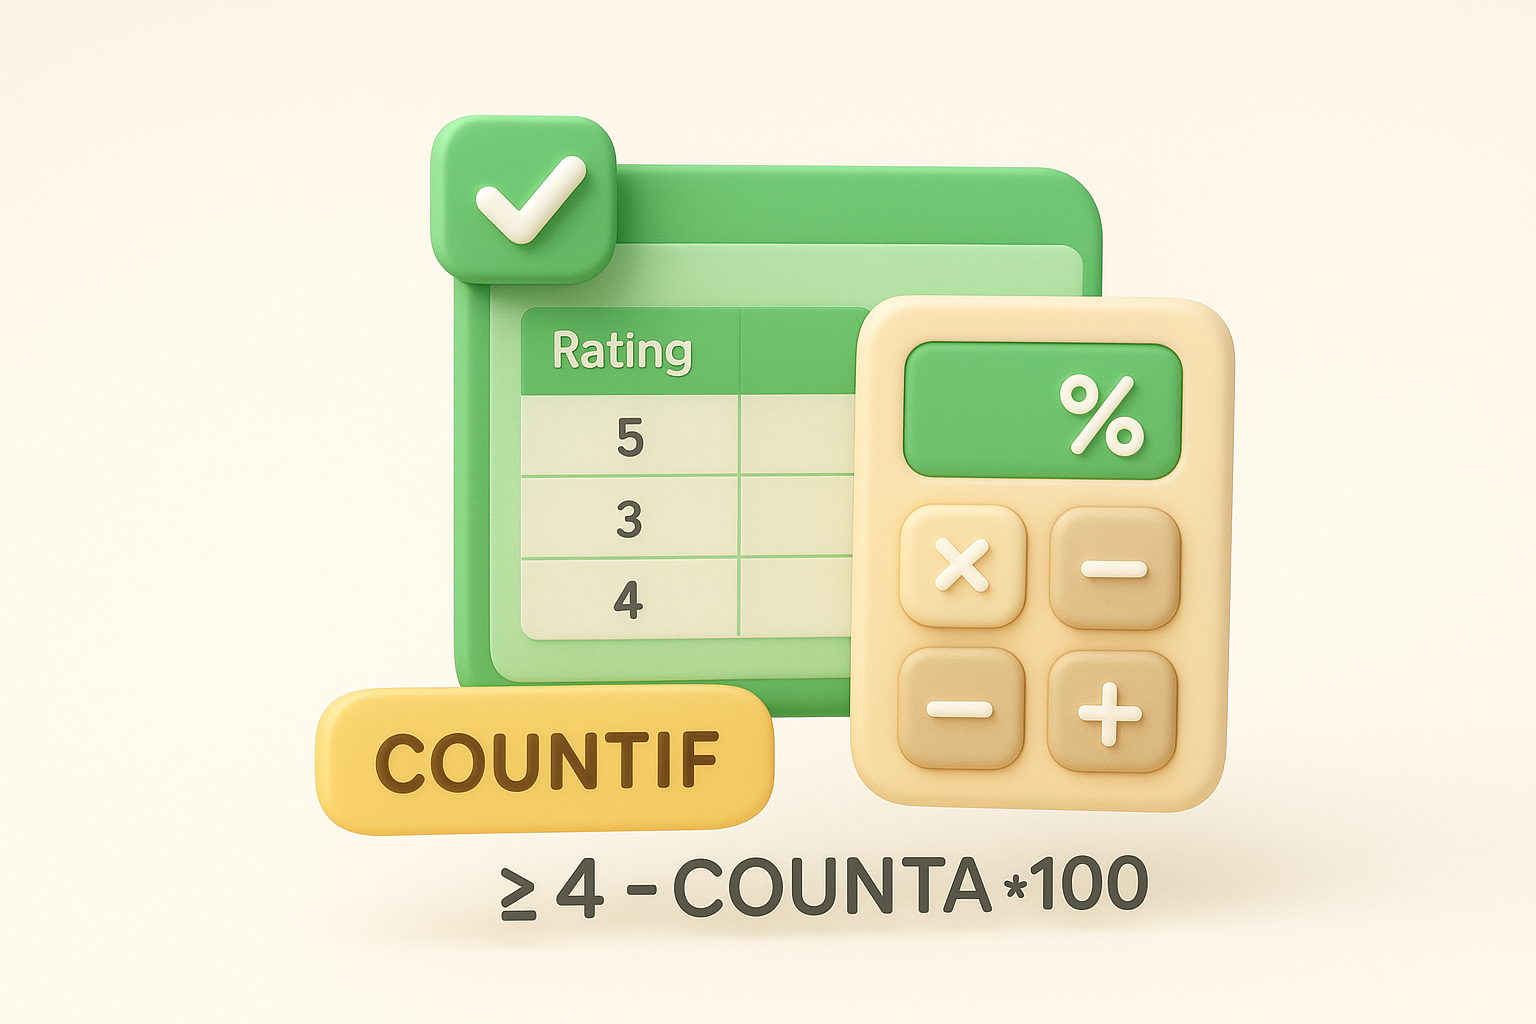
Use a named range for your ratings column so your formulas update automatically when you add new rows, without editing each cell reference manually.
In a blank cell, enter this formula, assuming ratings sit in column B from row 2 through row 101:
=COUNTIF(B2:B101,">=4")/COUNTA(B2:B101)*100
This formula returns your CSAT percentage directly, and you can reference that cell in a chart or summary table for clear, repeatable reporting every time new responses come in.
Once you know how to calculate CSAT score, the next challenge is understanding what that number actually means. A score of 75% might represent strong performance in one industry and mediocre results in another, so context matters before you draw any conclusions. Benchmarks give you that frame of reference by showing where your score stands relative to similar companies in your sector.
CSAT scores vary significantly across sectors, and comparing yourself to the wrong industry benchmark leads to false confidence or unnecessary concern. The American Customer Satisfaction Index (ACSI) publishes annual scores across major industries, giving you a reliable external reference point. Here are typical ranges to work with:
| Industry | Average CSAT Score |
|---|---|
| Software / SaaS | 78-80% |
| E-commerce | 79-82% |
| Financial services | 75-78% |
| Telecommunications | 65-70% |
| Healthcare | 74-77% |
Treat these numbers as directional guides rather than rigid targets, since your specific product type and customer base will shift what a strong score looks like for you.
Scores above 80% generally signal that most customers are satisfied, but chasing a perfect number often distracts teams from addressing real friction points. Focus on the trend direction across multiple periods instead. A score that climbs from 68% to 74% over two quarters tells you more than a static 80% with no movement.
Pairing your CSAT data with the specific survey questions that drove lower ratings helps you identify the exact areas worth fixing. Segmenting your score by product area, support channel, or customer type shows where problems concentrate rather than spreading your attention across the board.
Before you learn how to calculate CSAT score, you need clean, reliable data to calculate from. A poorly designed survey produces responses that look usable but actually reflect survey friction rather than genuine customer sentiment. Getting setup right from the start saves you from drawing misleading conclusions every time you run the numbers.
Your survey should ask one clear, direct question tied to a specific interaction, not a general opinion about your brand. A prompt like "How satisfied were you with your experience today?" works far better than vague questions that ask customers to evaluate multiple things at once. Keep your scale consistent across every survey you send, since mixing a 5-point scale in one campaign with a 7-point scale in another makes your scores impossible to compare over time.
Send your CSAT survey within 24 hours of the interaction you want to measure, since response rates and accuracy both drop significantly as time passes.
Low response rates are the most common problem teams ignore. If only 5% of customers respond, your score reflects only the most motivated respondents, which typically means the very satisfied and the very frustrated, skewing results in both directions. Aim for response rates above 20% by keeping your survey short and sending it through the right channel.
Changing your "satisfied" threshold mid-way through a tracking period is another pitfall that quietly breaks your data. If you shift from counting only 5s to counting 4s and 5s without noting the change, every comparison you make against older scores becomes meaningless.
Knowing how to calculate CSAT score gives your team a reliable, repeatable way to measure customer satisfaction rather than guessing at it. The formula is simple: divide satisfied responses by total responses and multiply by 100. What separates useful CSAT data from noise is the consistency you apply around it, including a fixed satisfaction threshold, a clean survey design, and regular tracking against industry benchmarks so your numbers stay comparable over time.
Pairing your CSAT scores with structured user feedback makes the real difference in how your team acts on the data. A score tells you something is wrong; the feedback tells you what and where. When both live in the same place, your product decisions become faster and more grounded in what users actually experience. If you want a platform that centralizes feedback collection alongside your roadmap progress, try Koala Feedback and start turning your satisfaction data into a clear action plan.

Start today and have your feedback portal up and running in minutes.