You're shipping features, collecting feedback, and watching usage metrics, but do you actually know whether your product's experience is getting better or worse? Without a structured way to measure UX, you're guessing. The Google HEART framework gives product teams a repeatable model for tracking what matters: user happiness, engagement, adoption, retention, and task success. It was developed by Google's research team to cut through vanity metrics and focus on signals that reflect real user experience.
Each of the five HEART dimensions maps to specific goals, signals, and metrics you can act on. Whether you're deciding which feature requests to prioritize or evaluating how a recent release landed, this framework gives you concrete categories to measure against. And when you pair it with a tool like Koala Feedback, where user sentiment and feature demand are already centralized, you get both qualitative and quantitative data working together.
This guide breaks down every component of the HEART framework, explains how to define goals and metrics for each dimension, and walks through the steps to put it into practice on your own product.
The Google HEART framework is a UX measurement model developed by Google researchers Kerry Rodden, Hilary Hutchinson, and Xin Fu. They created it to solve a specific problem: most teams default to tracking metrics like page views or session counts, which tell you something happened but not whether users actually had a good experience. HEART gives you five distinct dimensions to measure, each focused on a different aspect of what users feel and do in your product.
Google's research team published the framework in 2010 as part of a paper presented at the ACM CHI Conference on Human Factors in Computing Systems. The paper described how large-scale consumer products at Google struggled to evaluate UX in a consistent, meaningful way. The researchers needed a system that worked at scale, didn't require constant user interviews, and produced metrics product teams could act on. The result was HEART, which paired five top-level categories with a goals-signals-metrics process to turn those categories into trackable numbers.
The framework was built specifically to move teams away from engagement proxies and toward metrics that reflect genuine user experience quality.
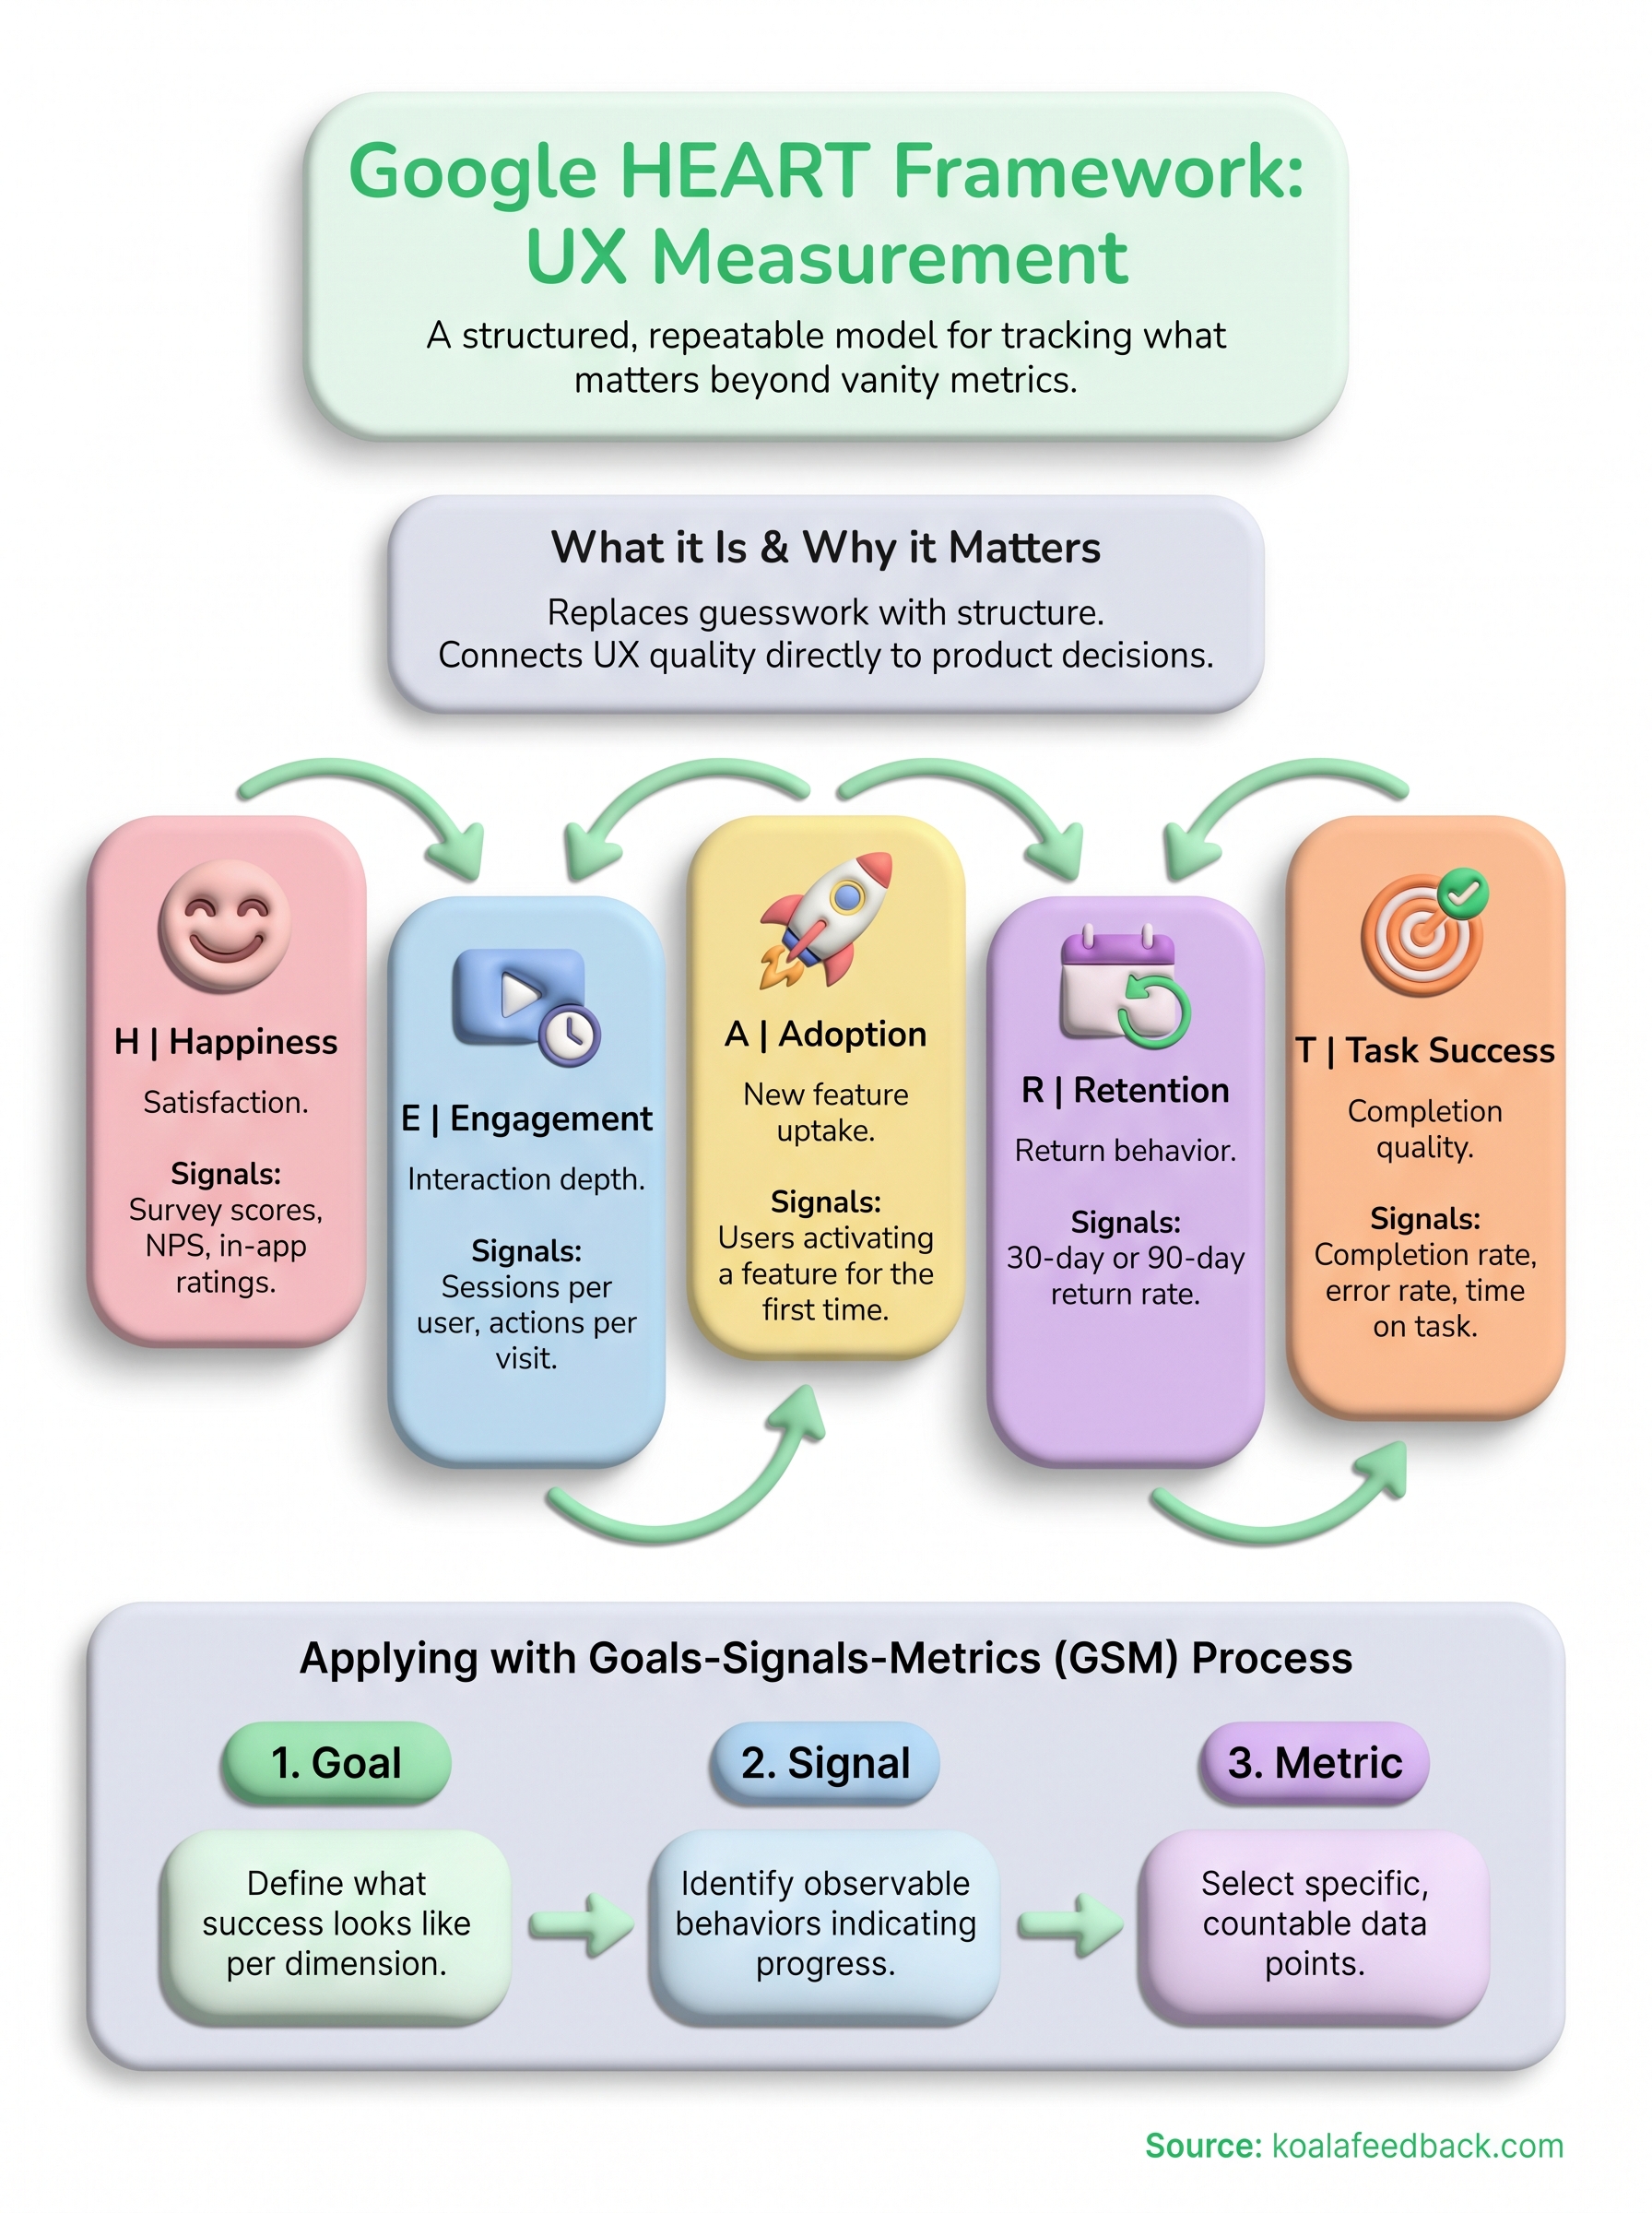
Each letter in HEART maps to a specific user experience dimension. Happiness covers subjective satisfaction, typically captured through surveys or ratings. Engagement measures how often and how deeply users interact with your product. Adoption tracks how many new users start using a feature or product within a given period. Retention looks at how many users return over time. Task Success focuses on whether users can complete key actions, measured through completion rates, error rates, or time on task.

Your team doesn't need to measure all five dimensions at once. The framework is designed to be modular and selective, so you pick the dimensions most relevant to what you're trying to learn. If you're evaluating a new onboarding flow, adoption and task success are the likely priorities. If you're assessing long-term product health, retention and happiness carry more weight.
Most product teams track metrics they can easily pull from analytics dashboards: sessions, page views, click counts. These numbers feel informative, but they don't tell you whether users are satisfied, successful, or likely to come back. The google heart framework addresses this gap by giving your team a structured vocabulary for UX measurement that goes beyond surface-level activity.
When your team debates whether a feature is working, the conversation often stalls because everyone is measuring something different. One person looks at adoption numbers, another checks support tickets, and someone else reads through user comments. The HEART framework aligns your team around shared dimensions, so you're comparing the same categories of data when making product decisions.
A shared measurement structure means fewer debates about which metric matters and more focus on what the data actually says.
The framework's real value is that it links user experience quality directly to decisions you make in your product roadmap. When you see that task success rates are dropping after a release, that's a signal to investigate before the problem compounds.
Retention data that trends downward over several weeks points to a deeper experience issue rather than a temporary dip. HEART gives you the categories to spot these patterns early, so you act on real evidence rather than a hunch about what users want next.
Each dimension in the google heart framework targets a specific aspect of user experience, so the data you collect under each one answers a different question about how your product is performing. The table below maps each metric to what you actually track day to day.
| Metric | What it measures | Example signals |
|---|---|---|
| Happiness | User satisfaction | Survey scores, NPS, in-app ratings |
| Engagement | Interaction depth | Sessions per user, actions per visit |
| Adoption | New feature uptake | Users activating a feature for the first time |
| Retention | Return behavior | 30-day or 90-day return rate |
| Task Success | Completion quality | Completion rate, error rate, time on task |
Happiness is the only purely subjective metric in the set. You collect it through surveys, in-app prompts, or Net Promoter Score responses. Because users self-report satisfaction, pairing happiness scores with behavioral data from the other dimensions gives you a fuller and more accurate picture of what's actually happening.
Happiness scores without behavioral context can mislead you, since users sometimes report satisfaction even when task completion rates are falling.
Engagement, Adoption, and Retention are behavioral metrics you pull directly from your analytics platform. Task Success typically requires funnel analysis or usability testing to measure whether users reach key actions without errors or drop-offs. You don't need to track all five dimensions simultaneously; start with the two or three that map most closely to your current product question.
The google heart framework doesn't work by picking metrics at random and watching them over time. It uses a goals-signals-metrics (GSM) process to connect what you want to achieve with data you can actually measure. For each dimension you choose to track, you define a goal first, then identify behavioral signals that indicate progress, and finally select the specific metrics that quantify those signals.

Your goal describes what a good user experience looks like for that dimension in plain terms. For example, under Retention, your goal might be: "Users return to complete a core task within 14 days of signup." The goal is not a metric itself; it's the outcome you want to move toward. Keeping it specific prevents your team from tracking signals that don't connect to anything useful.
Vague goals produce vague metrics, so write each goal as a concrete statement about what users should be doing or feeling.
Signals are the observable behaviors that tell you whether your goal is being met. If your Adoption goal is to get new users to activate a core feature, relevant signals include first-time feature clicks and guided setup completions. From those signals, you derive specific, countable metrics like the percentage of new users who activate the feature within seven days. This sequence matters because choosing metrics before goals leads to tracking numbers that look meaningful on a dashboard but don't answer the product question you actually need to resolve.
Once you've selected your dimensions and mapped your goals, signals, and metrics, the google heart framework works best when you run it as a repeatable cycle rather than a one-time audit. Set a fixed review cadence, such as every two weeks or monthly, and commit to checking each active dimension at the same interval so trends become visible over time.
A repeatable cycle turns scattered data points into trends you can act on, which is the entire point of running structured UX measurement.
Start by creating a shared document or spreadsheet that lists each dimension you're tracking, the goal it maps to, the signals you monitor, and the specific metric you're counting. Keep it simple enough that anyone on the team can update it in minutes.
Reviewing the document together in a regular team meeting prevents isolated interpretation of the data. When everyone sees the same numbers at the same time, product decisions stay grounded in shared evidence rather than individual assumptions.
When a metric moves in the wrong direction, treat it as a direct input for your next product decision, not just a number to log. If task success rates drop after a release, investigate where users are exiting or hitting errors rather than waiting for the trend to compound.
If retention falls below your baseline, cross-reference with happiness scores to check whether satisfaction is declining alongside return behavior. Closing this loop between measurement and action is what makes a HEART plan worth running.
The google heart framework gives your team a structured way to measure user experience without defaulting to metrics that look good on a dashboard but tell you very little about what users actually need. By working through goals, signals, and metrics for each dimension you select, you build a measurement plan that connects directly to product decisions rather than existing in a separate analytics silo.
The framework works best when you run it consistently and act on what the data reveals, not just record it. Pair your HEART metrics with the qualitative signals your users are already sending you. When users submit feedback, vote on requests, or flag pain points, that input reinforces or challenges what your UX numbers show. If you want a centralized place to capture and organize that user input alongside your measurement work, start with Koala Feedback to keep both streams of data in one place.

Start today and have your feedback portal up and running in minutes.