Google Analytics 4 changed how we measure whether visitors actually care about our content. Instead of tracking bounces, people who left, GA4 flips the script and tracks Google Analytics engagement metrics like engagement rate, engaged sessions, and average engagement time. These metrics tell you what users do on your site, not just what they don't do.
But the definitions can be confusing, and knowing what counts as a "good" rate is even trickier. Is a 60% engagement rate solid, or should you be worried? What does "engaged session" actually mean in practice? If you've found yourself squinting at GA4 reports trying to answer these questions, you're not alone.
Understanding these metrics matters because they directly inform how you improve your product. At Koala Feedback, we help teams collect and prioritize user feedback to build what people actually want, but engagement data from GA4 tells you where users are losing interest before they ever submit feedback. Pairing behavioral data with direct user input gives you the full picture.
This article breaks down every key GA4 engagement metric, explains how they differ from Universal Analytics, and provides benchmarks so you can gauge where you stand.
GA4 rebuilt the measurement model from scratch. In Universal Analytics (UA), session quality was largely inferred from what users did not do. If someone landed and left without triggering a second pageview, that counted as a bounce. GA4 discards that framing entirely. Google analytics engagement metrics in GA4 are built around positive signals instead: did the session meet a threshold of meaningful activity? This shift changes what your numbers actually tell you about your audience, and it requires a different mindset when reading your reports.
The foundation of every GA4 engagement metric is the engaged session. A session qualifies as engaged if it meets at least one of three conditions: the user stayed on the page or screen for 10 seconds or longer, the session included a conversion event, or the user viewed two or more pages or screens. If a session meets none of those, GA4 marks it as non-engaged. This means a single-page visit can still count as engaged, as long as the user spent meaningful time there.

An engaged session signals that a visit crossed a minimum threshold of real activity, not that the user necessarily found exactly what they were looking for.
From that definition, GA4 calculates three core metrics: engagement rate (engaged sessions divided by total sessions), average engagement time (total time your site was in the foreground divided by users or sessions, depending on the report), and engaged sessions per user (how often individual users return and meet the engagement threshold). These three figures anchor the Engagement overview report, and most other engagement data in GA4 builds on them.
The switch from bounce rate to engagement rate is the most visible change, but the underlying data architecture shifted too. In Universal Analytics, session timeouts and cookie-based tracking shaped how every metric was calculated. GA4 uses an event-based data model where every interaction, including page views, scrolls, and clicks, is a separate event, and sessions are constructed from those events rather than tracked independently.
This structural difference means you cannot map UA metrics to GA4 metrics and expect consistent numbers. Your engagement rate in GA4 will rarely match the inverse of your old bounce rate, because the definitions, session logic, and data collection methods all changed. Treat GA4 as a new baseline rather than a continuation of your UA history, or you risk drawing misleading conclusions from the comparison.
Knowing whether your visitors engage with your content shapes every decision you make about your product and marketing. Google analytics engagement metrics give you a real signal of user intent: someone who spends 45 seconds reading a feature page and clicks through to pricing behaves very differently from someone who loads the same page and closes it in two seconds. Without engagement data, you treat both visits the same way, which leads to flawed conclusions and wasted resources.
Tracking engaged sessions across different pages tells you exactly where your funnel breaks down. If your homepage sits at a 70% engagement rate but your pricing page sits at 30%, that gap points to something specific failing at the pricing stage. Whether the problem is unclear copy, a confusing layout, or missing information, the data directs you to the problem rather than leaving you to guess.
Engagement metrics don't tell you why users leave, but they tell you precisely where to start looking.
You can then pair that location-specific data with direct user feedback to understand the underlying reason. A drop in average engagement time on a feature page might correlate with users reporting that the benefits aren't clearly explained, giving you both the signal and the context to act on it.
When you bring engagement data into your product decisions, you stop building features based on gut instinct alone. A page with consistently low engaged sessions per user signals that returning visitors aren't finding new value there, which is useful input when you're deciding what to update or expand next.
Combining behavioral patterns from GA4 with user-submitted feature requests means your roadmap reflects both what users do and what they explicitly say they need. That combination is far more reliable than either data source on its own.
Understanding the specific numbers behind google analytics engagement metrics helps you read your GA4 reports with confidence. Each metric follows a clear formula, and knowing those formulas tells you exactly what GA4 is measuring and why the numbers shift when user behavior changes.
Engagement rate is the percentage of sessions that meet GA4's engaged session threshold. The formula is straightforward: divide the number of engaged sessions by total sessions, then multiply by 100. If you had 800 engaged sessions out of 1,000 total sessions, your engagement rate is 80%.
Engagement rate is the inverse of bounce rate only in concept, not in calculation, because the underlying session definitions are fundamentally different.
GA4 also shows you non-engaged sessions alongside a bounce rate, which in GA4 equals 100% minus engagement rate. Having both figures lets you view the same data from two angles without doing extra math yourself.
Average engagement time measures how long your site was in the foreground across a session or per user, depending on the report context. The formula divides total user engagement time (in seconds) by the number of users or sessions in the same period. A longer average signals that visitors are actively looking at your content rather than tabbing away immediately after loading the page.
Engaged sessions per user divides the total number of engaged sessions by the number of active users within your selected date range. This metric tells you how often individual users return and clear the engagement threshold on each visit. A higher number here suggests your content gives returning visitors a reason to keep interacting, which is a strong indicator that your product experience holds up over repeat visits.
GA4 surfaces google analytics engagement metrics in several places across the interface, and knowing where to look saves you from clicking through the wrong reports. The fastest starting point is the left-hand navigation panel in your GA4 property, where the Engagement section organizes all relevant reports in one place.
Open Reports > Engagement > Overview in your GA4 property, and you'll land on a dashboard that shows your engagement rate, engaged sessions, average engagement time, and engaged sessions per user for the selected date range. Each metric appears as a summary card at the top, with trend lines showing movement over time. Below those cards, GA4 breaks engagement data down by page, screen class, and event, so you can compare performance across individual URLs without leaving the report. You can adjust the date range in the top right corner to narrow or expand the window you're analyzing.
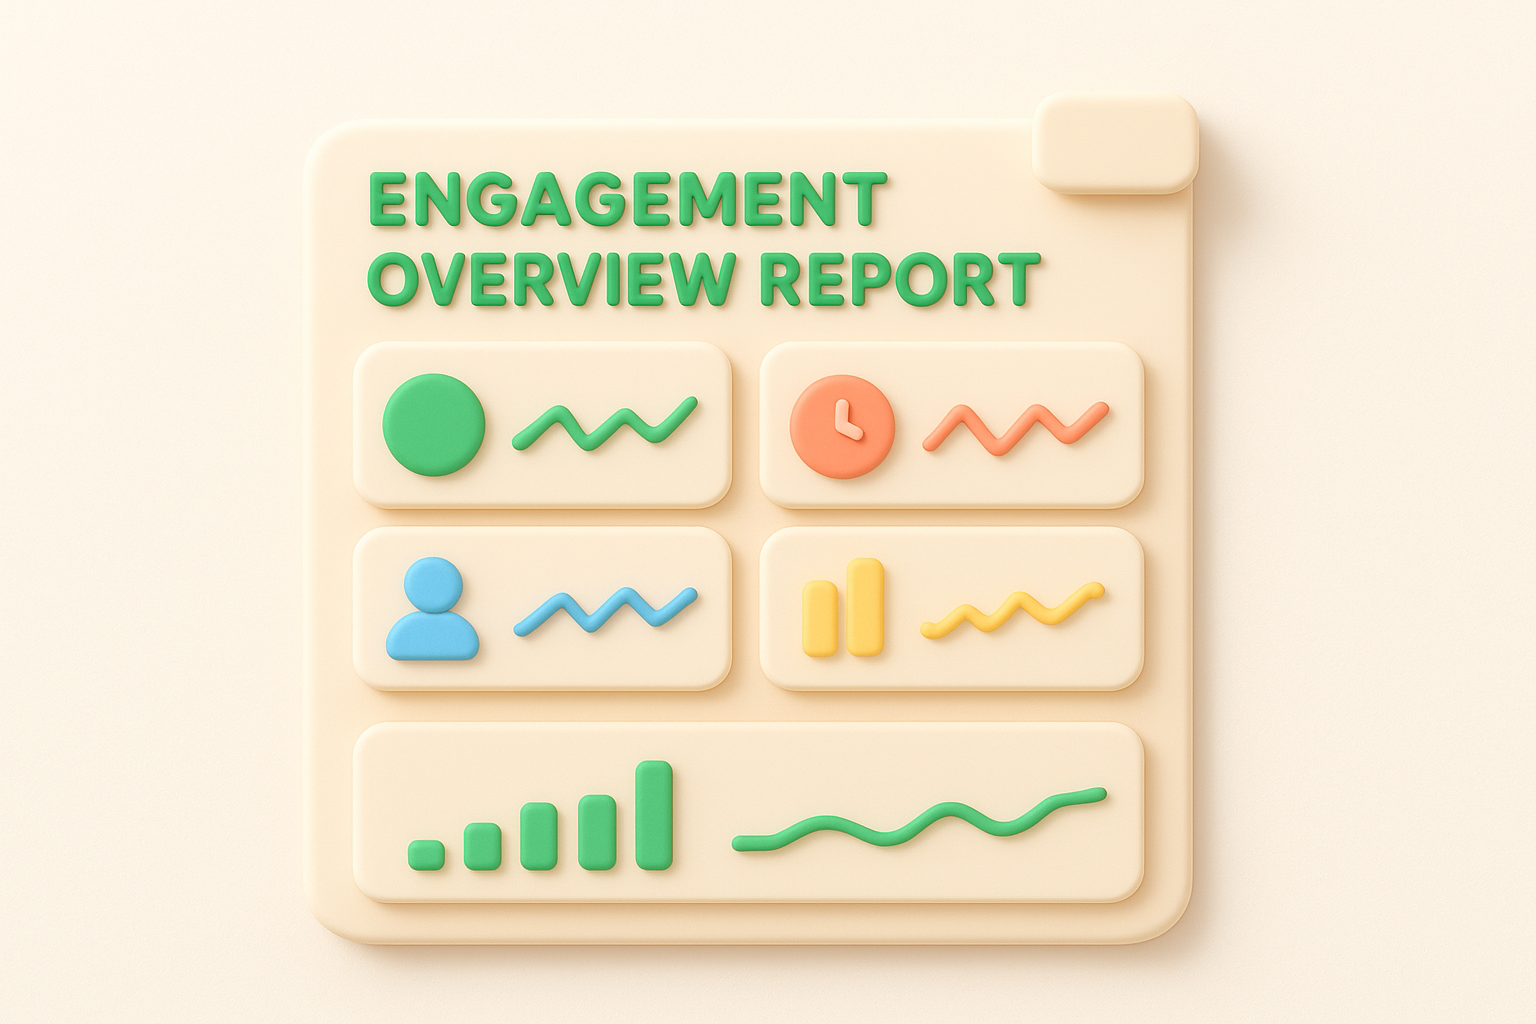
The Engagement Overview report is the fastest way to read session quality before diving into more granular breakdowns.
The Pages and Screens report under Engagement gives you a row-by-row breakdown of how individual pages perform on key metrics. Select it at Reports > Engagement > Pages and Screens, then use the column headers to sort by engagement rate, average engagement time, or views. Sorting by engagement rate lets you quickly spot which pages hold attention and which ones lose users fast. You can also add secondary dimensions, like device category or traffic source, to understand whether low engagement on a specific page ties to how users arrive rather than the content itself. This distinction shapes where you focus your next round of improvements.
No single number defines a good engagement rate for every site, but GA4's own data and industry research give you useful reference points. Most sites fall somewhere between 50% and 70% engagement rate, and landing in that range generally means your google analytics engagement metrics are healthy. Falling below 50% consistently signals that a large share of your traffic is not meeting even the minimum activity threshold, which usually points to a mismatch between what users expect and what they find on the page.
A 60% engagement rate is a reasonable starting benchmark for most sites, but your industry, content type, and traffic source matter more than any universal target.
Different industries see significantly different numbers, so comparing your rate against your own vertical gives you a more accurate read than comparing against a generic average. The table below shows rough engagement rate ranges by site type:
| Site Type | Typical Engagement Rate |
|---|---|
| SaaS and software | 55% to 75% |
| E-commerce | 45% to 65% |
| Blog or content site | 50% to 70% |
| News and media | 40% to 60% |
| B2B services | 60% to 80% |
These ranges shift depending on traffic source as well. Organic search visitors tend to engage more than display ad traffic, because they arrive with a specific intent already formed.
Your engagement rate target should move up or down based on the page type you're analyzing. A high-intent page like a pricing page or demo request form should clear 65% or higher, because users who navigate there are already evaluating your product. A broad blog post drawing cold traffic might reasonably sit at 50% without signaling a problem. Tracking engagement rate by page segment rather than site-wide averages gives you a far more actionable picture of where attention is actually holding.
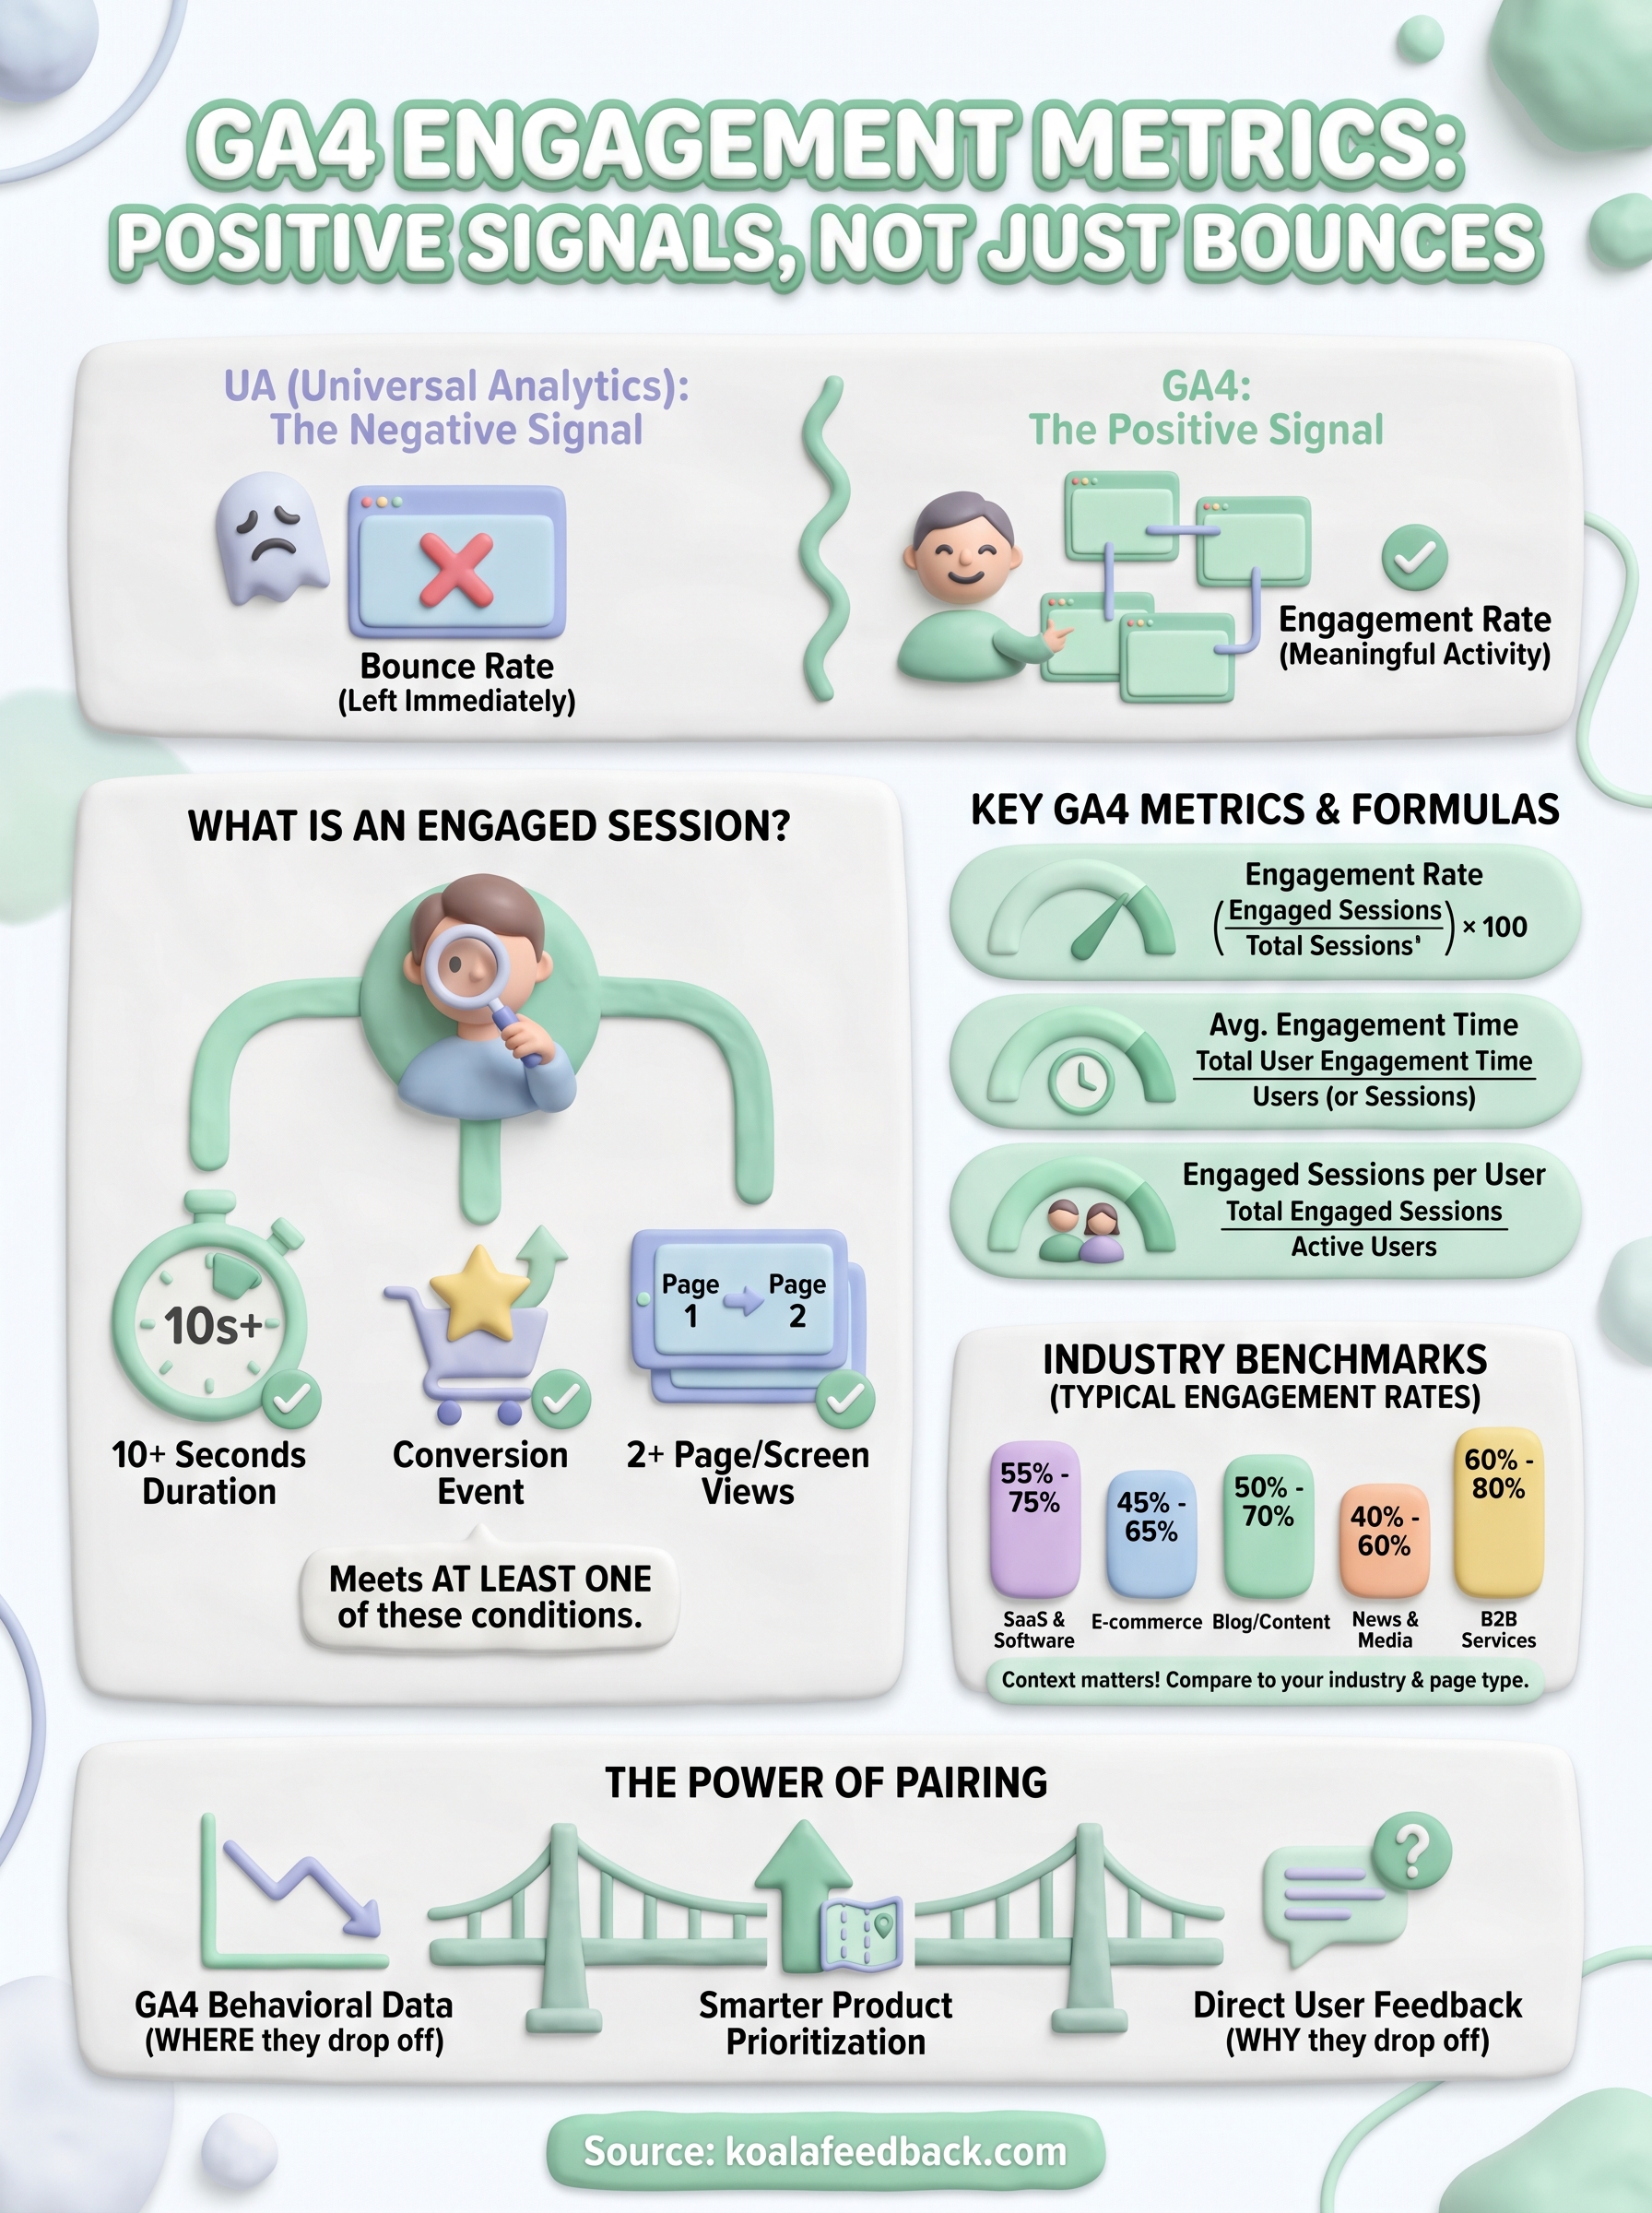
Google analytics engagement metrics in GA4 give you a concrete, positive-signal-based view of how users interact with your site. An engaged session requires at least 10 seconds of attention, a conversion, or two or more pageviews, and every other metric, from engagement rate to average engagement time, builds on that definition. Instead of counting who left, GA4 counts who showed up and stayed.
Benchmarks help, but context matters more. A 65% engagement rate on a pricing page means something very different from the same number on a cold-traffic blog post. Segment by page type and traffic source before drawing conclusions, and treat your own historical data as the most reliable baseline you have.
Behavioral data tells you where users lose interest, but it does not tell you why. Pairing GA4 with direct user input closes that gap. Collect and prioritize user feedback so you can act on both signals together.

Start today and have your feedback portal up and running in minutes.