You collect user feedback through surveys, support tickets, and feature requests. Then you hit a wall. The responses pile up, but you have no clear way to turn them into product decisions. You know the insights are there, but extracting them feels like guessing.
The problem is not the lack of feedback. The problem is the lack of method. Customer feedback analysis gives you a repeatable process to spot patterns, measure sentiment, and identify what matters most to your users. When you analyze feedback correctly, you stop guessing and start building what people actually want.
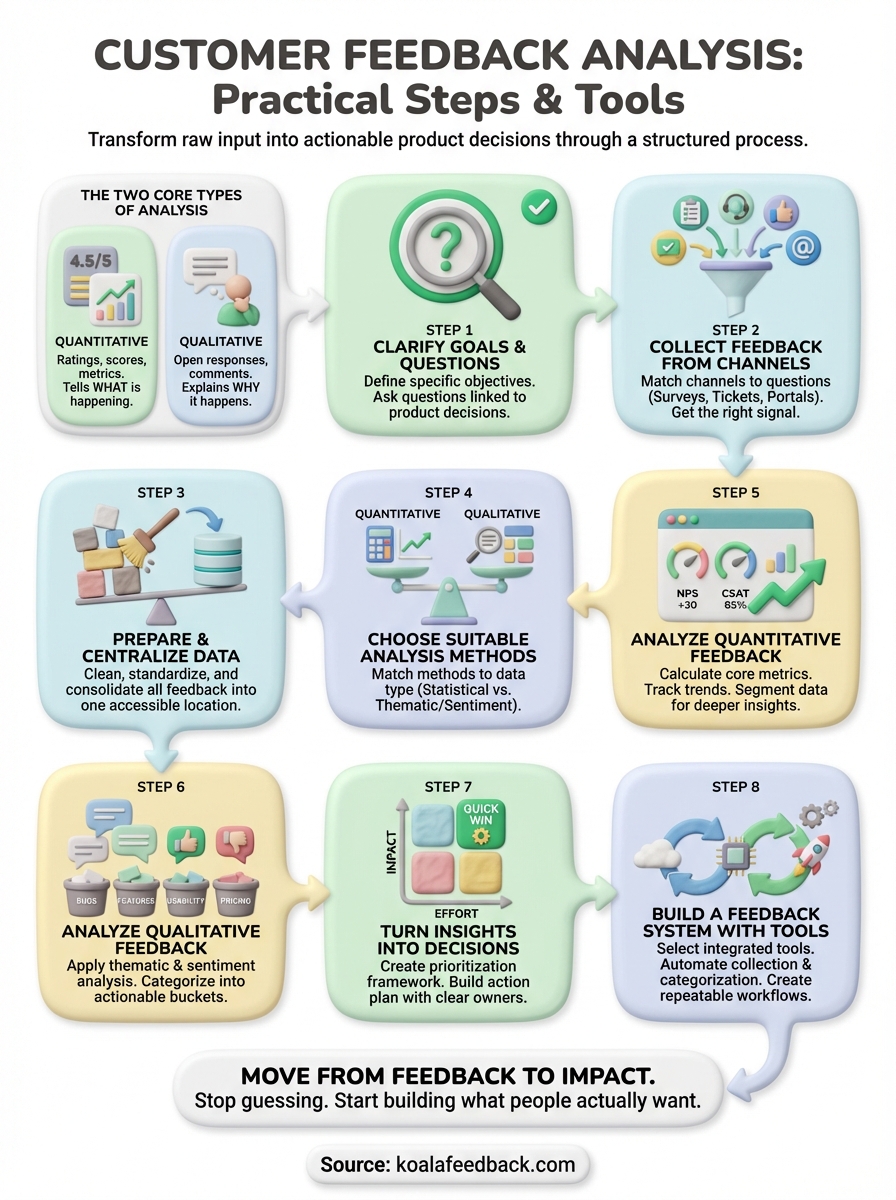
This guide walks you through eight practical steps to analyze customer feedback. You will learn how to set clear goals, choose the right analysis methods for your data type, and turn raw feedback into decisions. We will cover both quantitative methods like scoring and qualitative techniques like thematic analysis. You will also see examples, templates, and tools that make the process faster and more reliable.
Customer feedback analysis is the process of examining user input to identify patterns, measure satisfaction, and uncover actionable insights that guide product decisions. You take raw feedback from surveys, support tickets, reviews, and feature requests, then apply structured methods to understand what your users need, what frustrates them, and what drives their loyalty. The goal is not to read every comment, but to systematically extract meaning from the data you collect.
You work with two fundamental data types when you analyze feedback. Quantitative feedback includes ratings, scores, and metrics like NPS or CSAT that you can measure and compare over time. Qualitative feedback includes open-ended responses, comments, and conversations that reveal the reasoning behind user behavior. Effective customer feedback analysis methods combine both types to give you the full picture.
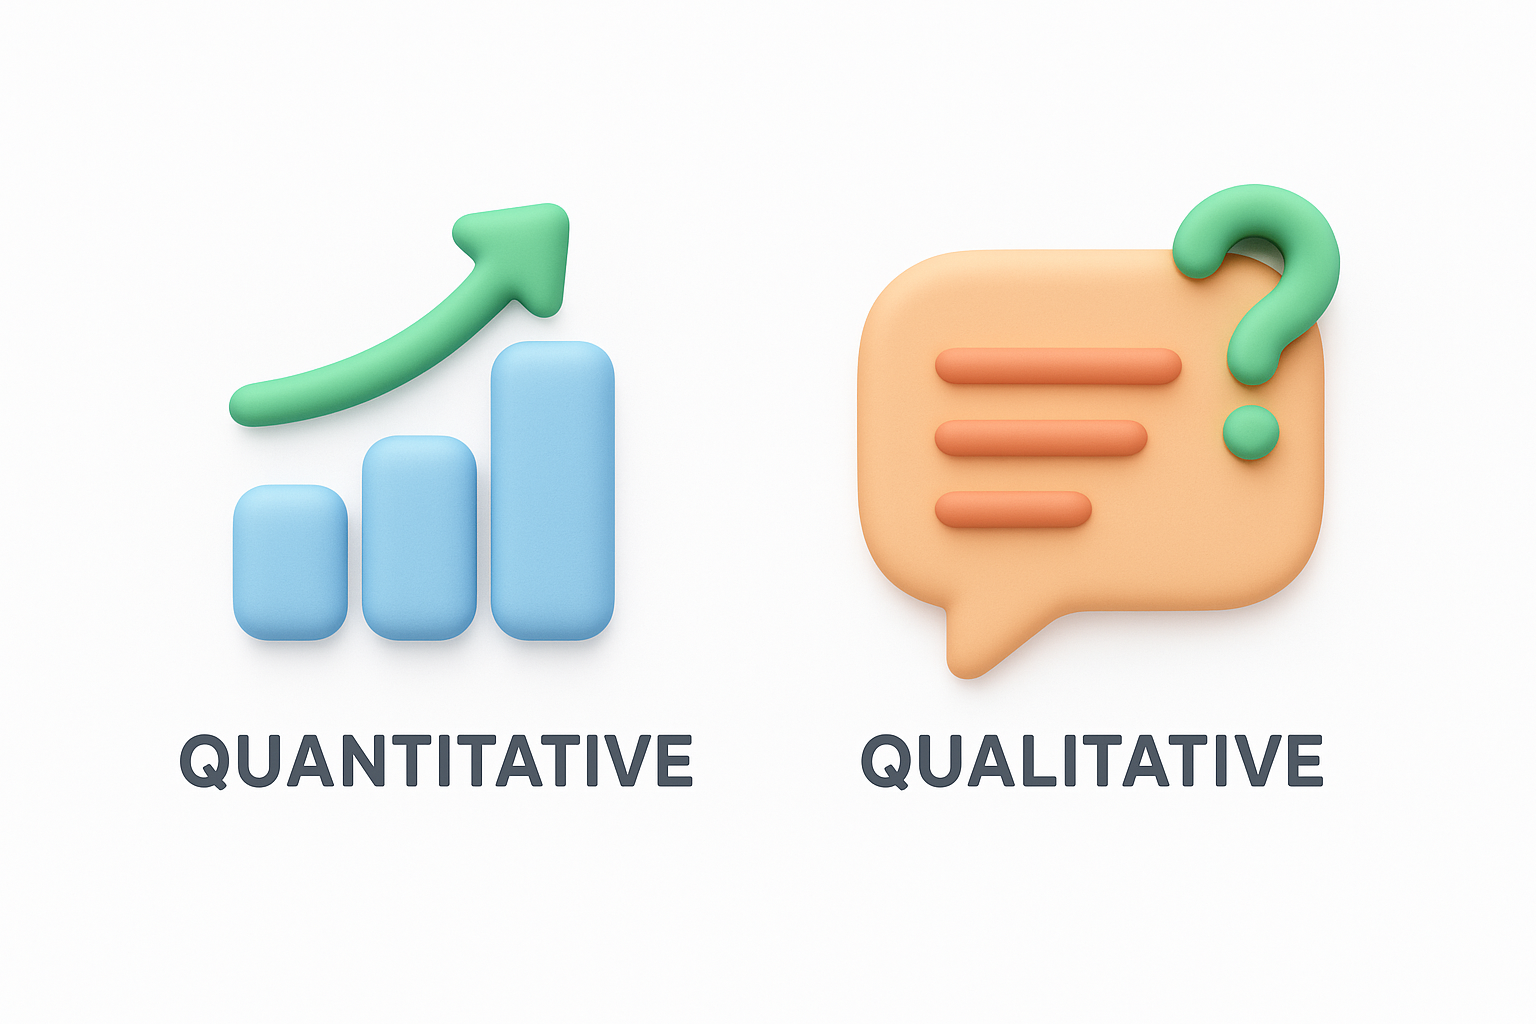
Quantitative data tells you what is happening, while qualitative data explains why it happens.
Analysis transforms feedback from a collection of opinions into prioritized action items. You identify which features users request most frequently, which problems cause the highest frustration, and which improvements will deliver the greatest impact on satisfaction. Instead of reacting to the loudest voices, you make decisions based on patterns across your entire user base. This approach helps you allocate resources to changes that matter most, validate roadmap priorities with real evidence, and demonstrate to your team and stakeholders that user needs drive your product strategy.
You cannot analyze feedback effectively without knowing what you want to discover. Before you dive into data, you must define your specific objectives and the questions you want to answer. This step determines which customer feedback analysis methods you will use, which data sources you will prioritize, and how you will measure success. Clear goals prevent you from drowning in irrelevant insights and guide you toward actionable conclusions that align with your product strategy.
Start by writing down specific questions that your analysis needs to answer. Vague goals like "understand user satisfaction" lead to vague results. Instead, ask targeted questions that connect directly to product decisions you need to make. Frame your questions around the outcomes you can actually influence through your product roadmap.
Consider these example questions based on common scenarios:
Your questions should lead to decisions, not just interesting observations.
Transform your questions into concrete metrics you can track. If you want to understand onboarding frustration, decide whether you will measure it by the number of negative comments, the sentiment score of onboarding-related feedback, or the percentage of users who mention specific pain points. Measurable outcomes let you know when your analysis is complete and help you communicate findings to stakeholders who need hard numbers.
Create a simple framework that connects each question to a metric. For example, if your question is "Which bugs frustrate users most?", your metric might be "number of unique users reporting each bug type". Document these connections in a table or spreadsheet before you start analyzing. This upfront work saves hours of circular analysis later and ensures your effort produces results that drive product improvements rather than just interesting charts.
Your analysis is only as good as the feedback you collect. Different channels capture different types of insights, and the customer feedback analysis methods you use later depend on the quality and format of your source data. You need to select channels that match the questions you defined in step one and give you the signal-to-noise ratio you need. Random feedback from multiple disconnected sources creates analysis paralysis. Strategic channel selection gives you focused data that answers your specific questions.
Choose feedback channels based on the type of insight you need, not just convenience. If you want to understand why users churn, exit surveys and cancellation feedback forms give you direct answers. If you need to prioritize feature requests, an in-app feedback widget or dedicated roadmap portal captures structured demand signals. Support tickets reveal pain points and bugs, while social media monitoring shows unfiltered reactions and competitive comparisons.
The channel shapes the feedback, so align your data sources with your analysis goals.
Create a simple mapping between your questions and the channels most likely to provide answers:
| Question Type | Best Channels | Data Format |
|---|---|---|
| Why do users churn? | Exit surveys, cancellation forms, support tickets | Qualitative + metrics |
| Which features do users want? | Feature request portal, in-app widgets, roadmap voting | Quantitative votes + comments |
| What frustrates users most? | Support tickets, bug reports, live chat logs | Qualitative descriptions |
| How satisfied are users overall? | NPS surveys, CSAT surveys, app store reviews | Quantitative scores + comments |
Focus on channels you can access consistently and that provide structured data formats. You should prioritize sources where users voluntarily share detailed input:
Select three to five channels that cover both solicited feedback (surveys, feedback forms) and unsolicited feedback (support tickets, social posts). This combination prevents selection bias and gives you a complete view of user sentiment across different contexts.
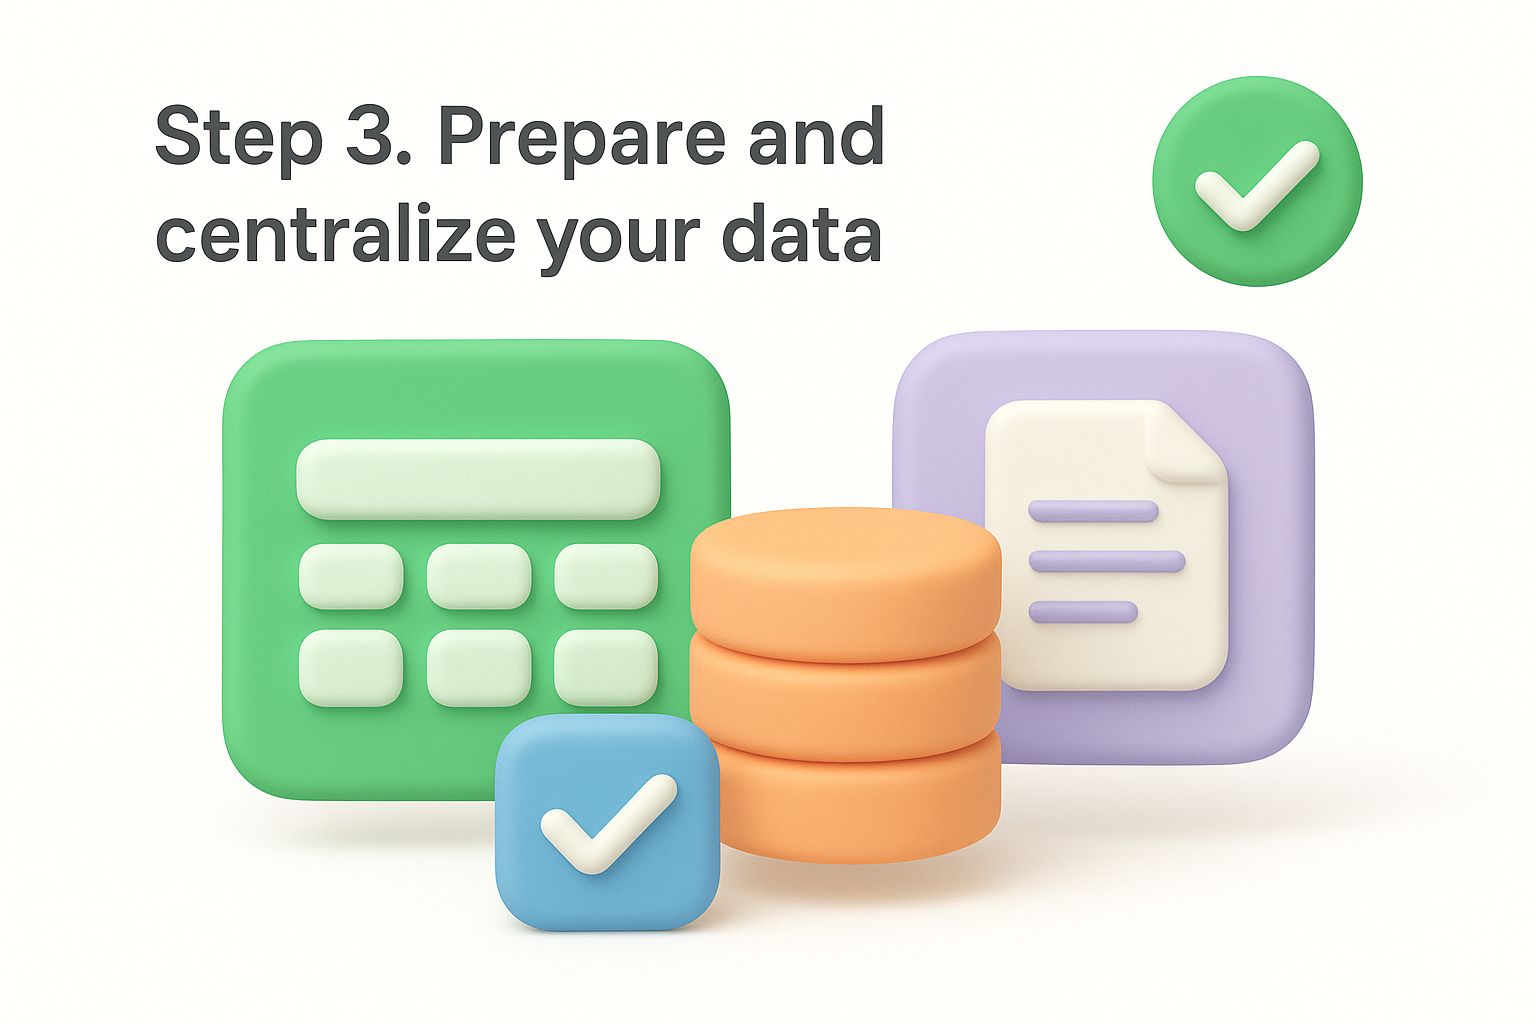
Raw feedback from multiple channels arrives in different formats, contains duplicates, and often includes irrelevant noise. Before you can apply any customer feedback analysis methods, you must clean and organize your data into a single accessible location. This preparation step determines the quality of your analysis. Messy data produces unreliable insights, wastes time during analysis, and leads to incorrect conclusions. Investment in proper data preparation now saves hours of frustration later and ensures your analysis reflects actual user sentiment rather than data artifacts.
Remove duplicates, spam, and incomplete responses first. Check for feedback entries that lack essential information like submission date, user segment, or the actual comment text. Filter out test submissions, bot responses, and entries where users simply typed nonsensical characters. These cleanup tasks prevent garbage data from skewing your analysis and consuming your attention during the interpretation phase.
Standardize formatting across all sources so you can compare feedback accurately. Convert all dates to a single format like YYYY-MM-DD. Normalize rating scales if some channels use 1-5 stars while others use 1-10 scores. Tag each entry with its source channel so you can filter or segment during analysis. Create consistent category labels if different channels use different terminology for the same concept.
Clean data is not optional when you want reliable insights from your analysis.
Apply these specific cleanup actions to your dataset:
Export all cleaned feedback into one spreadsheet or database table. You need every piece of feedback in the same place so you can sort, filter, and analyze without jumping between systems. Structure your central repository with these essential columns: submission date, user ID or segment, source channel, rating or score if applicable, full text comment, and any tags or categories you have assigned.
Build your repository with clear column headers and consistent data types. Use a format that supports the analysis tools you plan to use next. A simple spreadsheet works for datasets under 10,000 rows, while larger volumes require a database or specialized feedback platform. The key is accessibility so anyone on your team can review the data and verify your analysis conclusions when needed.
Your cleaned and centralized feedback needs the right analysis approach. The customer feedback analysis methods you select depend on your data type, the questions you defined in step one, and the resources you have available. Quantitative feedback requires statistical methods that measure patterns and trends, while qualitative feedback needs interpretive techniques that extract meaning from text. Choosing the wrong method wastes time and produces insights that do not match your goals. You must match your analytical approach to both your data format and your desired outcomes.
You have two distinct data types in your repository, and each requires different analysis methods. Quantitative feedback includes ratings, scores, and structured multiple-choice responses that you can count and calculate. Qualitative feedback includes open-ended comments, descriptions, and narrative responses that you must interpret and categorize. Most feedback datasets contain both types, so you will use multiple methods in combination to get complete insights.
Select methods based on this mapping between data type and appropriate technique:
| Data Type | Analysis Method | What You Get |
|---|---|---|
| Ratings, scores, NPS | Statistical analysis, trend tracking | Satisfaction levels, changes over time |
| Multiple-choice questions | Frequency counts, cross-tabulation | Distribution of responses, segment differences |
| Open-ended comments | Thematic analysis, sentiment analysis | Common themes, emotional tone |
| Feature requests | Frequency analysis, voting counts | Demand signals, priority ranking |
| Support tickets | Root cause analysis, categorization | Problem patterns, impact assessment |
Match your method to your data format, or you will extract the wrong insights from your feedback.
Manual analysis works when you have fewer than 500 feedback entries and need deep understanding of nuanced responses. You read each comment, assign categories, and identify patterns through direct interpretation. This approach gives you complete control over categorization decisions and helps you catch subtle insights that automated tools might miss. Manual methods require hours of focused work but produce highly accurate results when you have the time.
Automated or semi-automated analysis becomes necessary when your feedback volume exceeds 1,000 entries or when you need real-time insights. Tools that apply natural language processing, sentiment detection, and automatic categorization can process thousands of responses in minutes. You sacrifice some nuance but gain speed and scalability. Choose automated methods when your dataset is large, when feedback arrives continuously, or when you need to update your analysis weekly or monthly rather than quarterly.
Start with manual methods for your first analysis cycle to understand your data deeply, then move to automated approaches as your feedback volume grows. This progression lets you build category frameworks based on real patterns before you rely on algorithms to maintain them.
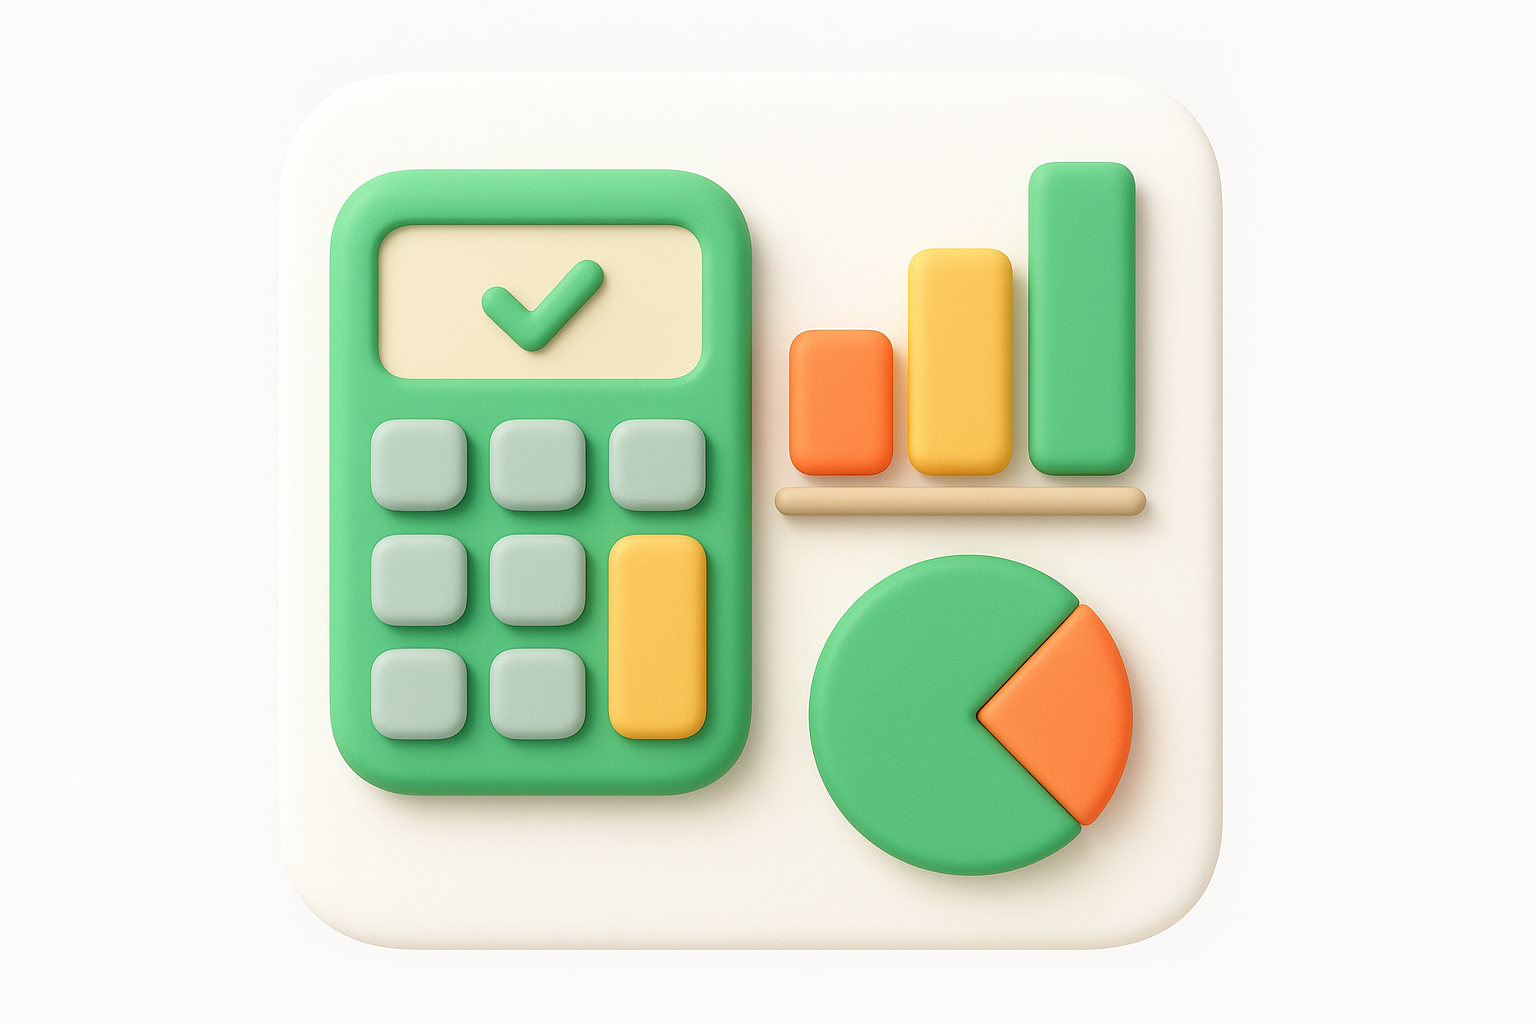
Quantitative feedback gives you measurable data points that you can track, compare, and use to spot trends. Your ratings, scores, and structured responses become concrete numbers that tell you whether satisfaction is rising or falling, which segments are most satisfied, and how your product performs against benchmark targets. The advantage of quantitative customer feedback analysis methods is objectivity. You eliminate subjective interpretation and work with data that produces consistent results every time you run the analysis. This section shows you how to extract actionable insights from your numerical feedback data.
Start by calculating the standard metrics that let you compare your performance against industry benchmarks. Net Promoter Score (NPS) measures loyalty by asking users to rate their likelihood to recommend your product on a 0-10 scale. You subtract the percentage of detractors (scores 0-6) from the percentage of promoters (scores 9-10) to get your NPS. Customer Satisfaction Score (CSAT) typically uses a 1-5 scale and you calculate it as the percentage of users who selected the top two ratings (4 or 5).
Apply these formulas to your cleaned dataset:
| Metric | Calculation | Good Score |
|---|---|---|
| NPS | (% Promoters) - (% Detractors) | Above +30 |
| CSAT | (Number of 4-5 ratings / Total responses) × 100 | Above 80% |
| Average Rating | Sum of all ratings / Number of ratings | Above 4.0/5 |
| Response Rate | (Responses / Surveys sent) × 100 | Above 20% |
Your baseline metrics establish the starting point for tracking improvement over time.
Calculate these metrics for your entire dataset first, then break them down by time period and user segment in the next steps. Document your calculations in a spreadsheet so you can replicate the process each month or quarter.
Compare your metrics across different time periods to identify whether satisfaction is improving or declining. Look at monthly or quarterly changes rather than daily fluctuations, which contain too much noise to reveal meaningful patterns. A consistent upward trend in NPS indicates your product changes are resonating with users. A sudden drop in CSAT during a specific month signals that something went wrong that period, and you need to investigate the qualitative feedback from that timeframe to understand why.
Build a simple trend table that shows your key metrics over the last six months:
| Month | NPS | CSAT | Avg Rating | Sample Size |
|---|---|---|---|---|
| Aug | +25 | 78% | 3.9 | 324 |
| Sep | +28 | 81% | 4.1 | 412 |
| Oct | +31 | 83% | 4.2 | 398 |
Break down your metrics by user segment to discover which groups are most or least satisfied. Segment by customer type (free vs. paid), industry, company size, feature usage level, or any other demographic data you collect. This segmentation reveals whether specific user groups experience your product differently and helps you prioritize improvements that matter most to your target audience.
Create comparison tables that show metric differences across segments. You might discover that enterprise customers have an NPS of +45 while small business users score only +15, indicating you need to focus product improvements on features that serve smaller teams better. Segment analysis transforms general satisfaction scores into targeted insights that guide specific product decisions.
Qualitative feedback contains the detailed explanations that quantitative scores cannot capture. Your open-ended comments reveal why users gave specific ratings, what problems they face in their own words, and which features they want most. While quantitative analysis tells you that satisfaction dropped, qualitative customer feedback analysis methods show you that the drop happened because your latest update broke a key workflow. You need systematic approaches to extract patterns from hundreds or thousands of text responses without losing the nuance that makes qualitative data valuable.
Thematic analysis identifies recurring themes across your feedback comments. You read through responses, note common topics, and group similar feedback together into categories that represent shared user needs or problems. This method reveals which issues affect multiple users rather than isolated complaints. Start by reading a sample of 50-100 comments to identify potential themes, then create a coding framework that you apply to your entire dataset.
Follow this process to conduct thematic analysis:
Thematic analysis transforms scattered comments into organized categories that reveal which issues matter most to your users.
Document your themes in a simple framework that anyone can apply consistently:
| Theme | Definition | Example Comment |
|---|---|---|
| Onboarding friction | User struggled during initial setup | "Took 30 minutes to figure out how to connect my account" |
| Missing feature | User requested capability that does not exist | "I need bulk export but can only download one at a time" |
| Performance issue | User experienced slow loading or crashes | "App freezes whenever I open the dashboard" |
| Pricing concern | User mentioned cost as a barrier | "Would upgrade if the pro plan was more affordable" |
Sentiment analysis determines whether feedback expresses positive, negative, or neutral emotion. You classify each comment based on the tone and word choices users employ. This method helps you prioritize which feedback requires immediate attention because highly negative sentiment often correlates with churn risk. Manual sentiment analysis works by reading each comment and assigning a sentiment label. Automated sentiment analysis uses natural language processing tools, but manual classification gives you better accuracy for product-specific terminology.
Create a three-tier sentiment scale for your feedback. Label comments as positive when users express satisfaction, praise features, or describe successful outcomes. Mark comments as negative when users report frustration, describe problems, or threaten to switch products. Assign neutral sentiment to factual statements or suggestions that lack emotional content. Track what percentage of your feedback falls into each category and watch how these percentages change over time.
Beyond themes and sentiment, you need categories that map directly to teams who will act on the feedback. Create buckets that align with your organizational structure so each category has a clear owner. Product bugs go to engineering, feature requests go to product management, and billing issues go to finance. This categorization system transforms analysis into immediate action by routing feedback to the right people automatically.
Build a categorization framework with these standard buckets:
| Category | Responsible Team | Action Type |
|---|---|---|
| Bug report | Engineering | Fix in next sprint |
| Feature request | Product management | Add to roadmap consideration |
| Usability issue | Design | Include in UX review |
| Documentation gap | Support | Update help articles |
| Billing problem | Finance | Resolve individual case |
| Integration request | Partnerships | Evaluate demand level |
Assign each piece of feedback to exactly one primary category, then add secondary tags for themes and sentiment. This multi-dimensional classification gives you the flexibility to filter your feedback dataset by team, by theme, or by urgency depending on what questions you need to answer. Your categorized feedback becomes a searchable database that supports ongoing product decisions rather than a one-time analysis exercise.
Analysis produces insights, but insights without action waste your time and damage user trust. You must convert your findings into concrete decisions that change your product roadmap, improve user experience, or fix problems users face. This step transforms customer feedback analysis methods from academic exercises into business results. Create a clear path from insight to implementation so every analysis cycle produces visible improvements that users notice and appreciate.
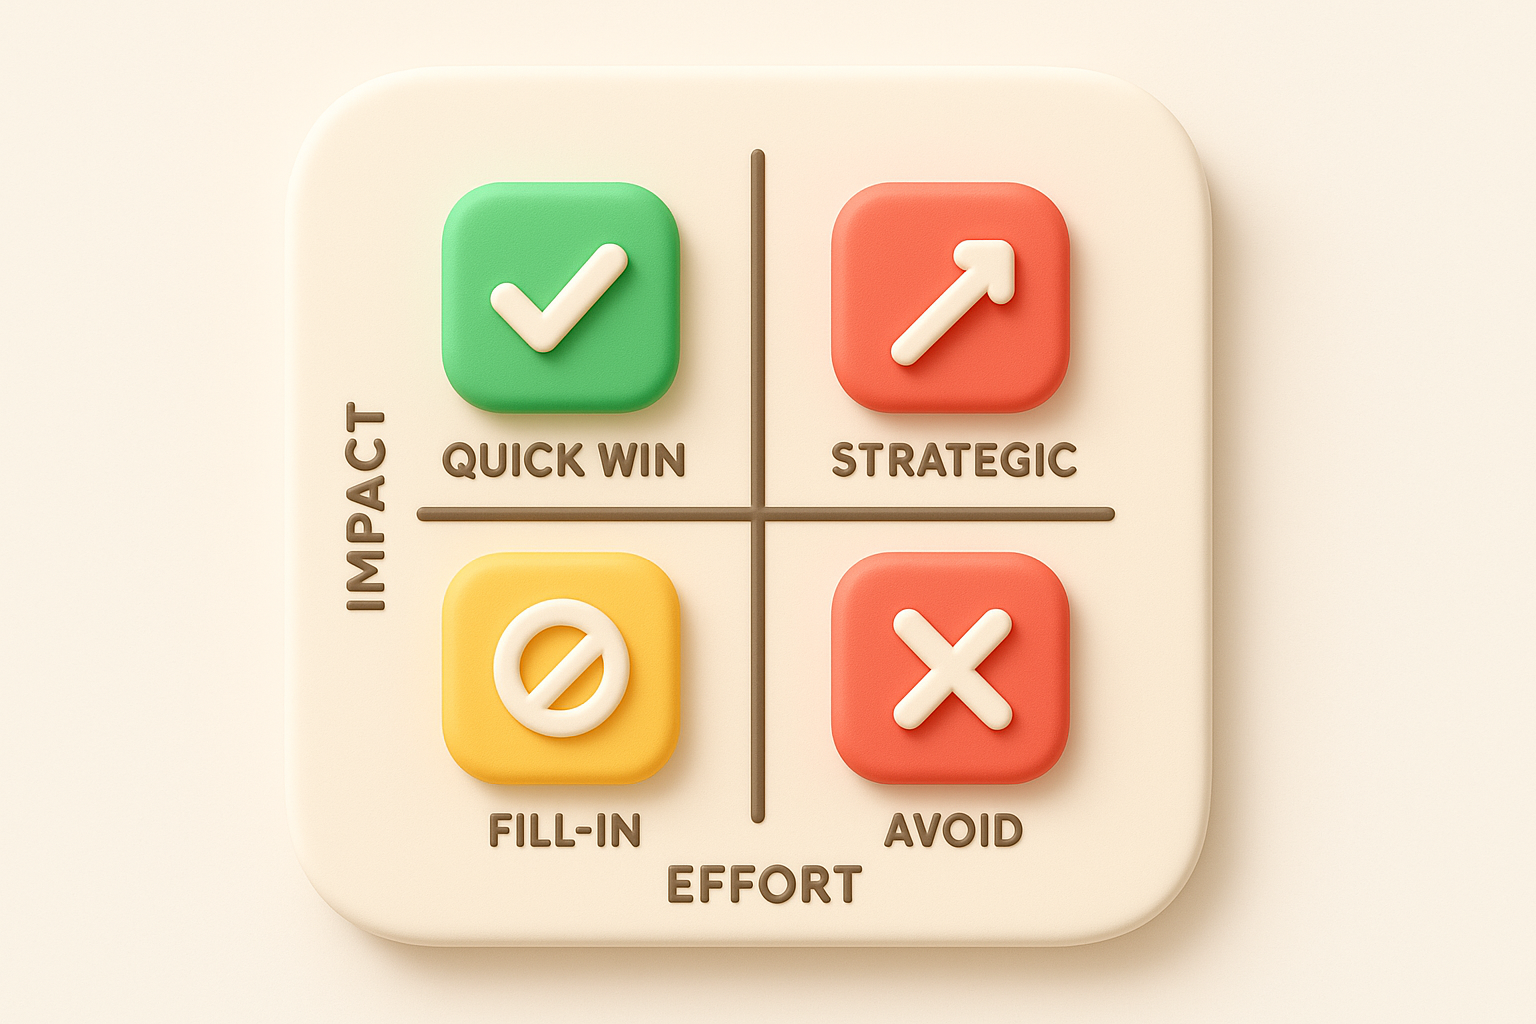
You cannot fix everything at once, so rank your insights by impact and effort. Build a simple priority matrix that plots each finding on two axes: how many users the issue affects and how much effort implementation requires. Focus first on high-impact, low-effort improvements that deliver quick wins. Address high-impact, high-effort items next because they matter most to your users even though they take longer to complete.
Apply this framework to categorize your action items:
| Priority | Impact | Effort | Action Timeline |
|---|---|---|---|
| Quick win | High | Low | Next sprint |
| Strategic | High | High | Next quarter |
| Fill-in | Low | Low | Backlog |
| Avoid | Low | High | Defer indefinitely |
Prioritization based on user impact prevents you from building features that only a vocal minority requests.
Assign each prioritized insight to a specific team member who will own the implementation. Vague assignments like "engineering should look at this" result in no action. Name a person, set a deadline, and define what success looks like. Document your action plan in a shared spreadsheet or project management tool so everyone knows their responsibilities and you can track progress.
Structure your action items with this template:
| Insight | Action Required | Owner | Deadline | Success Metric |
|---|---|---|---|---|
| 42% of users request bulk export | Add bulk export to dashboard | Product Manager | Feb 15 | Feature usage >30% |
| Onboarding takes average 45 min | Simplify setup wizard to 3 steps | UX Designer | Jan 30 | Time to complete <15 min |
| 18% negative sentiment on mobile | Fix top 3 mobile bugs | Engineering Lead | Jan 22 | Negative sentiment <10% |
Inform users when you implement changes based on their feedback. Send an email announcement highlighting which user requests you addressed, post updates in your changelog, or notify users directly in your product interface. This communication proves you listen to feedback and encourages users to share more input in the future. Your response rate on future surveys increases when users see their previous feedback created real results.
Your one-time analysis delivers value, but a repeatable system multiplies that value across every future cycle. You need tools and processes that make customer feedback analysis methods part of your regular workflow rather than a quarterly project. Building a system means automating data collection, standardizing your analysis process, and creating dashboards that update automatically. The right setup reduces manual work from hours to minutes and ensures you never miss important feedback signals while your team focuses on building product improvements.
Choose a central platform that connects to all your feedback sources automatically. You want one tool that pulls data from surveys, support tickets, feature requests, and reviews into a single database. Look for solutions that offer API integrations with your existing systems so feedback flows in without manual exports. A feedback management platform like Koala Feedback centralizes requests, enables user voting, and displays your roadmap all in one place, eliminating the need to jump between disconnected tools.
Evaluate tools based on these essential capabilities:
| Capability | Why It Matters |
|---|---|
| Multi-channel integration | Combines all feedback sources automatically |
| Automatic categorization | Applies your tagging framework without manual work |
| User segmentation | Filters feedback by customer type or behavior |
| Voting and prioritization | Shows which requests have broadest demand |
| Public roadmap | Closes the loop by showing users what you build |
Your tool selection determines how much manual effort each analysis cycle requires, so invest time in choosing platforms that reduce repetitive tasks rather than just organizing your existing process.
Set up automated workflows that tag and route feedback as it arrives. Configure rules that assign categories based on keyword detection in the feedback text. For example, any comment containing "crash," "freeze," or "error" automatically gets tagged as a bug report and routes to your engineering team. Comments with "would be great if" or "wish I could" get flagged as feature requests for product management review.
Automation transforms continuous feedback streams into organized insights without daily manual sorting.
Build your automation rules using this template:
IF feedback contains ["slow", "loading", "performance"]
THEN tag as "Performance Issue"
AND assign to Engineering Team
AND set priority to "High"

IF feedback contains ["price", "cost", "expensive"]
THEN tag as "Pricing Concern"
AND assign to Product Team
AND set priority to "Medium"
Document your analysis process so anyone on your team can run it consistently. Write a step-by-step checklist that covers data export, cleanup, categorization, metric calculation, and reporting. Schedule your analysis cycles at regular intervals like weekly for critical metrics or monthly for comprehensive reviews. Your workflow documentation prevents analysis quality from depending on one person's knowledge and makes it easy to train new team members on your feedback practices.
Set up automatic reports that deliver key metrics to stakeholders without manual compilation. Configure your tools to send weekly summaries showing NPS trends, new feature request volumes, and top bug categories directly to team leads. Automated reporting keeps everyone informed and reduces the time you spend creating presentations from raw feedback data.
Beyond the core customer feedback analysis methods covered in previous steps, you can apply specialized techniques when you face specific challenges. Root cause analysis helps you dig deeper into recurring problems, while pre-built templates accelerate your setup process. These additional approaches complement your primary workflow and give you flexible options for different feedback scenarios. You should add these methods to your toolkit once you have mastered the fundamental steps outlined earlier in this guide.
Root cause analysis traces problems back to their underlying causes rather than treating surface symptoms. When you notice the same complaint appearing repeatedly across your feedback channels, you need to investigate why the issue exists instead of just counting how often it occurs. This method uses the "five whys" technique where you ask "why" five times in succession to drill down from the visible problem to the root cause that drives it.
Apply this framework to analyze a recurring complaint:
Problem: Users report that data sync fails frequently

Why 1: Why does sync fail?
Answer: The API times out after 30 seconds

Why 2: Why does the API timeout?
Answer: Large datasets take longer to process

Why 3: Why do large datasets take so long?
Answer: We process all records in a single batch

Why 4: Why process everything at once?
Answer: Original design didn't account for growth

Why 5: Why wasn't growth considered?
Answer: No scalability requirements in initial planning

Root Cause: Missing scalability requirements led to architectural limitations
Use this spreadsheet template to organize your analysis workflow and track progress. Copy the structure below into your preferred tool and customize categories to match your product needs. The template consolidates all essential columns you need to move from raw feedback to prioritized actions efficiently.
| Feedback ID | Date | Source | User Segment | Text | Category | Theme | Sentiment | Priority | Owner | Status |
|---|---|---|---|---|---|---|---|---|---|---|
| 001 | 2026-01-05 | Survey | Enterprise | Cannot export reports | Feature | Reporting | Negative | High | PM | Planned |
| 002 | 2026-01-06 | Support | SMB | Mobile app crashes | Bug | Performance | Negative | High | Eng | In Progress |
| 003 | 2026-01-07 | Portal | Startup | Love the new UI | Praise | Design | Positive | Low | Design | Complete |
This template transforms disconnected feedback into a structured database that your entire team can search, filter, and act upon.
You now have a complete framework to analyze customer feedback systematically. The eight steps you learned transform raw feedback into prioritized product decisions that improve user satisfaction and retention. When you apply these customer feedback analysis methods consistently, you stop guessing about what users want and start building features that deliver the most value to your audience.
The next action you take determines whether this guide becomes another article you read or the foundation of your product strategy. Start small by analyzing your most recent 100 feedback entries using the methods and templates provided here. Clean your data, categorize the responses, calculate your baseline metrics, and identify your top three improvement opportunities. This first analysis cycle teaches you the process and delivers immediate insights you can act on this week.
Koala Feedback centralizes your feedback collection, voting, and roadmap sharing in one platform so you spend less time organizing data and more time building what users request most.

Start today and have your feedback portal up and running in minutes.
