You collect feedback from users through surveys, support tickets, feature requests, and social media. The data piles up. You know it holds valuable insights about what users want, what frustrates them, and where your product falls short. But raw feedback alone does not tell you what to build next or which problems to fix first.
Feedback analysis turns scattered comments and ratings into clear patterns and priorities. It helps you spot recurring issues, understand user sentiment, and make confident decisions about your product roadmap. Instead of guessing which features matter most, you rely on real evidence from the people who use your product every day.
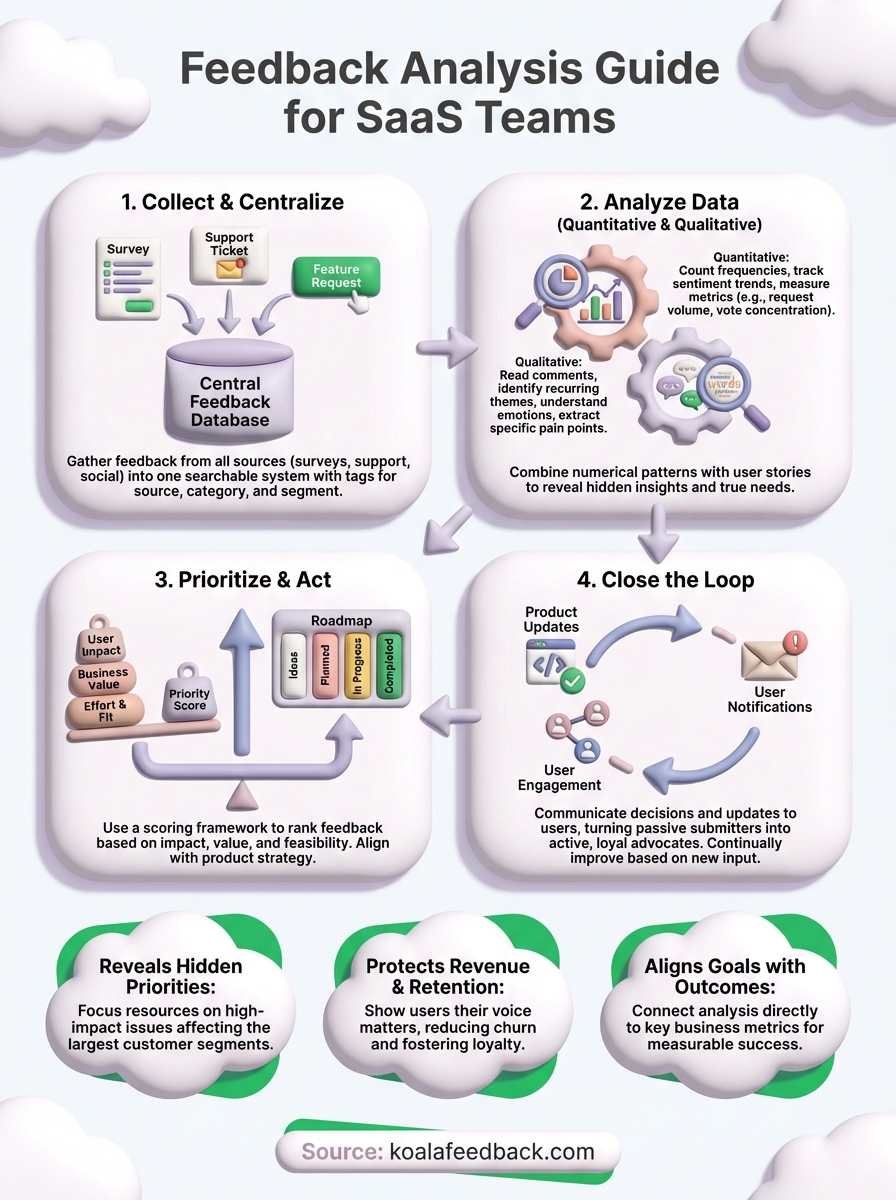
This guide explains what feedback analysis means for SaaS teams, why it matters more than just collecting feedback, and how to do it step by step. You will learn practical methods for analyzing both numbers and text, see which metrics to track, and discover tools that simplify the process. By the end, you will know how to transform feedback into actions that improve your product and keep users engaged.
Feedback analysis is the systematic process of reviewing and interpreting user feedback to identify patterns, measure sentiment, and extract actionable insights. You examine comments, ratings, survey responses, support tickets, and feature requests to understand what users actually think and need. This process transforms individual opinions into clear trends and priorities that guide product decisions.
Every feedback analysis effort involves three distinct activities. First, you organize feedback into categories like feature requests, bug reports, usability issues, and general satisfaction. This sorting helps you see which topics appear most frequently and which areas of your product generate the strongest reactions.
Second, you measure both numbers and meaning. Quantitative data includes ratings, scores, and vote counts. Qualitative data covers the words users write, the emotions they express, and the specific problems they describe. You need both types to understand the full picture.
Effective analysis combines what users say with how often they say it and how strongly they feel about it.
Third, you connect insights to action. Analysis only matters when it influences decisions. You identify which problems affect the most users, which requests align with your strategy, and which fixes deliver the biggest impact. The goal is not just to understand feedback but to know exactly what to do next based on that understanding.
Understanding what is feedback analysis helps you see why collection alone falls short. You can gather thousands of comments and ratings, but without analysis, you miss the signal in the noise. SaaS teams face unique pressure because users expect constant improvement and quick responses to problems. When you skip analysis, you waste time building features nobody wants, miss critical bugs that frustrate loyal customers, and lose competitive ground to products that actually listen.
Feedback analysis exposes which issues affect your largest customer segments and which requests would drive the most value. You might receive 50 feature requests in a month, but analysis shows that three of them account for 80% of user votes and comments. Without that clarity, you spread your development resources too thin or prioritize based on whoever complains the loudest. Analysis gives you confidence to say no to low-impact requests and yes to changes that matter.

Analysis transforms gut feelings into evidence-based decisions that align your team around clear priorities.
Users who submit feedback are actively engaged with your product. When you analyze their input and act on it, you show them their voice matters. This strengthens loyalty and reduces churn. Conversely, when feedback sits unread or unanalyzed, engaged users become frustrated advocates who warn others away. Analysis helps you spot early warning signs of dissatisfaction before they turn into cancellations. You identify which pain points cause the most friction in the user journey and fix them before they cost you customers. The business impact compounds over time as satisfied users renew, upgrade, and refer others.
Before you start reviewing feedback data, you need to define what you want to learn and why it matters. Vague goals like "understand users better" lead to unfocused analysis that wastes time and produces unclear results. Specific questions guide your attention to the right data and help you recognize meaningful patterns when they appear. Without clear objectives, you risk analyzing everything superficially instead of digging deep where it counts.
Start by writing down three to five concrete questions that your feedback should answer. These questions should reflect real decisions you need to make about your product, roadmap, or user experience. Good questions point to specific areas where you lack clarity and where user input can fill the gap.
Example questions that lead to actionable analysis:
Clear questions transform feedback analysis from a general exploration into a targeted investigation with measurable outcomes.
Your feedback analysis goals should connect directly to business metrics you want to improve, such as retention rate, feature adoption, support ticket volume, or Net Promoter Score. This alignment ensures that insights you discover actually matter to your company's success. When you tie analysis to metrics, you can measure whether the actions you take based on feedback produce the results you expected.
Write down which specific metric each question aims to impact. If you want to know why users churn early, your goal connects to improving 90-day retention. If you investigate onboarding friction, you target increased activation rates or faster time-to-value. This connection between questions and outcomes helps you prioritize which feedback to analyze first when you face time constraints or overwhelming data volume.
You cannot analyze feedback effectively when it sits scattered across multiple tools and channels. Support tickets live in your helpdesk, feature requests pile up in email, survey responses sit in forms, and social media mentions get lost in notifications. Understanding what is feedback analysis requires you to first solve this fragmentation problem by bringing all feedback into one place where you can see patterns across sources. This step builds the foundation for everything that follows because incomplete data leads to incomplete insights.
Start by listing every channel where users share opinions, report problems, or request features. Most SaaS teams collect feedback through in-app widgets, email, support conversations, sales calls, user interviews, social media, review sites, and community forums. Each source captures different types of users at different moments in their journey. New users might submit feedback during onboarding, frustrated users contact support when something breaks, and engaged users vote on feature requests in your roadmap tool.
Map out which sources generate the highest volume and which attract your most valuable customer segments. This inventory helps you prioritize which channels to monitor closely and which deserve automation. You do not need to capture every single comment from every possible source, but you must cover the channels where your core users actively communicate their needs.
Choose one system where all feedback will ultimately land, regardless of where it originates. This could be a dedicated feedback management platform, a structured spreadsheet, or a project management tool with custom fields. The key requirement is that every piece of feedback gets tagged with consistent metadata including source, date, user segment, category, and sentiment.
Build a simple tagging structure before you start importing feedback:
| Tag Type | Example Values |
|---|---|
| Source | Support ticket, in-app widget, email, social media, survey |
| Category | Feature request, bug report, usability issue, praise |
| User Segment | Free trial, paying customer, enterprise, churned |
| Priority | High impact, medium impact, low impact |
| Status | New, under review, planned, in progress, completed |
A centralized database turns fragmented feedback into searchable, filterable data that reveals patterns you would never spot across disconnected tools.
Manual copying and pasting from different sources wastes hours every week and introduces human error. Set up automated workflows that push feedback from collection points into your central system. Most feedback widgets integrate directly with popular tools through APIs or webhooks. You can also use automation platforms to connect channels like email, Slack, or support tickets to your database.
Create templates for manual entries when automation is not possible. For example, after user interviews or sales calls, team members should log feedback using a standard format that includes verbatim quotes, context about the user's goals, and specific problems mentioned. This consistency ensures that feedback from every source can be analyzed together rather than requiring separate review processes for each channel.
Now that you have centralized your feedback, you need to extract meaning from it through two complementary approaches. Quantitative analysis reveals patterns through numbers, scores, and vote counts. Qualitative analysis uncovers the reasons, emotions, and specific details behind user opinions. Most teams make the mistake of focusing on only one type, but understanding what is feedback analysis means recognizing that both methods work together to deliver complete insights. Numbers show you which problems matter most by volume, while words explain why those problems frustrate users and what would solve them.
Begin your analysis by calculating basic frequency counts for each feedback category. Count how many feature requests, bug reports, usability complaints, and positive comments you received. Then drill down to see which specific features get requested most often, which bugs appear repeatedly, and which parts of your product generate the most praise. These numbers immediately show you where users focus their attention.
Track sentiment distribution across your feedback volume. Calculate what percentage of feedback expresses positive, negative, or neutral sentiment. Compare these percentages across different user segments, time periods, or product areas to spot trends. For example, if 60% of feedback from enterprise customers skews negative while 80% from small teams stays positive, you know where satisfaction problems concentrate.
Use these core quantitative metrics for every analysis cycle:
| Metric | What It Reveals | Action Threshold |
|---|---|---|
| Request frequency | Which features users want most | Top 5 requests = 50%+ of total volume |
| Vote concentration | Where agreement is strongest | Single request with 30%+ of votes |
| Sentiment ratio | Overall satisfaction trend | Negative feedback above 40% signals crisis |
| Time to resolution | How responsive you appear | Average response time above 7 days hurts trust |
| Segment variance | Which users face unique problems | 20%+ sentiment difference between segments |
Quantitative metrics give you the confidence to prioritize based on evidence rather than opinions from the loudest stakeholders.
Read through actual user comments for your top five most frequent issues. Do not just skim for keywords. Pay attention to the specific language users choose, the examples they provide, and the intensity of emotion they express. You will often discover that two feature requests with similar titles actually describe completely different problems once you read what users wrote.
Look for patterns in how users describe their pain points and desired outcomes. Group similar phrases and complaints together. For example, ten users might request "better reporting" but their comments reveal three distinct needs: faster export speeds, more customizable dashboards, and automated report scheduling. This distinction matters because each solution requires different development effort and serves different use cases.
Apply this simple qualitative coding method to organize text feedback:
Merge your quantitative and qualitative findings to build actionable conclusions. For example, you might discover that "mobile app improvements" ranks third in request frequency (quantitative), but reading the comments reveals that 90% of those requests specifically complain about offline functionality (qualitative). This combination tells you exactly what to build rather than forcing you to guess which mobile improvements matter most.
Create a simple analysis summary for each major issue that includes three specific data points: how many users mentioned it, what percentage of your user base that represents, and a direct quote that captures the core problem in the user's own words. This format makes it easy to share insights with your team and defend prioritization decisions when stakeholders question your choices. The numbers prove impact, and the quote brings the human problem to life in a way that motivates action.
Analysis only creates value when it leads to concrete decisions and visible action. You have identified patterns, counted frequencies, and understood user pain points. Now you need to decide which problems to solve first and show users that their feedback influenced real changes. This step transforms what is feedback analysis from an internal research activity into a customer engagement strategy that builds trust and loyalty. Your prioritization framework determines which improvements ship next, and your communication plan proves to users that you listen.
Create a scoring system that evaluates each feedback item against multiple criteria rather than relying on vote counts alone. You need to balance user demand with business strategy, technical feasibility, and expected impact. A basic framework assigns points for each factor and produces a total priority score that guides your roadmap decisions.
Use this four-factor scoring model to rank feedback items consistently:
| Factor | Low (1 point) | Medium (2 points) | High (3 points) |
|---|---|---|---|
| User impact | Affects <5% of users | Affects 5-20% of users | Affects >20% of users |
| Business value | Nice to have | Supports growth goal | Critical for retention/revenue |
| Implementation effort | High effort (>4 weeks) | Medium effort (1-4 weeks) | Low effort (<1 week) |
| Strategic fit | Does not align with roadmap | Partially aligns | Fully aligns with strategy |
Calculate the total score for each item by adding points across all four factors. Items scoring 10 or above become immediate priorities. Scores between 7 and 9 go into your planned backlog. Anything below 7 stays in the ideas list for future consideration. This systematic approach removes emotion from prioritization debates and helps you defend decisions with objective criteria that anyone on your team can understand and apply.
Transparent prioritization criteria help users understand why some requests ship quickly while others wait, turning potential frustration into respect for your process.
After you decide which feedback to act on, communicate those decisions back to the specific users who submitted the feedback. This closes the loop and transforms passive feedback submission into active engagement. Send individual emails to users when their requested feature ships, their reported bug gets fixed, or their suggestion moves to your planned roadmap.
Use this template to acknowledge feedback you will not build:
Hi [Name],

Thank you for suggesting [feature]. We reviewed your request along with feedback from [X] other users who mentioned similar needs.

After analysis, we decided to focus on [alternative priority] instead because [specific reason that connects to user benefit].

We kept your suggestion in our ideas list. If more users request this or our strategy shifts, we will reconsider it.

We appreciate you taking time to share your thoughts.

[Your name]
Update your public roadmap or feedback board to reflect status changes when you start building requested features, complete them, or decide against them. Users who voted or commented receive automatic notifications about these updates. This visibility demonstrates that feedback directly influences your product direction and encourages ongoing participation in your feedback program.
You need practical tools and clear metrics to execute what is feedback analysis successfully. The right measurement framework shows you whether your analysis efforts produce results, while specific examples demonstrate how to apply analysis methods to real feedback. This section gives you concrete resources you can implement immediately without requiring advanced technical skills or expensive enterprise software.
Your feedback analysis program needs quantitative measures that prove its value to stakeholders and help you improve over time. Track these five core metrics monthly to evaluate your feedback program's health and impact on your product decisions.
| Metric | How to Calculate | Target Benchmark |
|---|---|---|
| Feedback response rate | (Feedback received / Active users) × 100 | 5-10% of active users |
| Average time to first response | Sum of hours between submission and acknowledgment / Total submissions | Under 48 hours |
| Closure rate | (Feedback acted upon or resolved / Total feedback) × 100 | 60-70% quarterly |
| Feature request concentration | Top 10 requests / Total feature requests | Above 50% |
| Sentiment improvement rate | (Positive sentiment this month - Last month) / Last month × 100 | Positive trend month over month |
Monitor feedback velocity by counting how many new submissions you receive each week. Sudden spikes often indicate a bug or usability problem that needs immediate attention. Drops in submission volume might signal that users stopped believing their feedback matters, which threatens engagement and increases churn risk.
Consider a real scenario where you receive 200 pieces of feedback in one month. First, categorize them: 120 feature requests, 50 bug reports, 20 usability complaints, and 10 praise comments. This breakdown immediately shows that feature requests dominate your feedback volume, suggesting users find your core product stable but want more functionality.
Next, analyze the 120 feature requests by counting duplicates. You discover that 45 users requested export functionality, 30 wanted mobile access, 25 asked for integrations, and 20 mentioned various other features. Export functionality becomes your clear priority because it represents 38% of all feature requests and affects a significant user segment.
Simple frequency counting combined with direct quote analysis reveals exactly what to build next without complex statistical models or expensive consultants.
Read through the 45 export requests to find patterns. Users mention "CSV export," "bulk data download," "report automation," and "scheduled exports." These variations reveal that users actually describe three distinct needs: one-time manual exports, automated recurring exports, and specific file format support. This qualitative insight prevents you from building a generic export feature that satisfies nobody completely.
Dedicated feedback management platforms like Koala Feedback centralize collection, voting, and roadmap communication in one interface. You avoid the fragmentation problem by capturing feedback through widgets, email, and direct submission while automatically deduplicating similar requests and organizing them into logical boards. Users vote on requests, comment with additional context, and receive updates when status changes occur.
Alternative approaches include using structured spreadsheets with columns for date, source, category, user segment, priority score, and status. Add a column for verbatim quotes so you preserve user language during analysis. Free survey tools like Google Forms collect feedback systematically, though you need manual processes to analyze responses and track actions taken.
Whatever tools you choose, ensure they support tagging and filtering so you can slice feedback by segment, time period, or category. This capability transforms overwhelming data volumes into manageable subsets that reveal specific patterns. Start simple and add sophistication only when your feedback volume justifies the investment in advanced features or automation.
You now understand what is feedback analysis means and how to transform raw user input into product decisions that drive growth. The difference between successful SaaS teams and struggling ones often comes down to this systematic approach: collect feedback from every source, analyze both numbers and words, prioritize based on evidence, and communicate actions back to users. Skip any step and you lose valuable insights or fail to build trust with your most engaged customers.
Start your analysis practice today by centralizing feedback from your top three sources into one database. Tag 50 recent submissions using the category and priority frameworks from this guide. Calculate your current feedback response rate and sentiment distribution to establish baseline metrics. Most importantly, close the loop on at least five feedback items this week by updating their status and notifying the users who submitted them. Koala Feedback helps you manage this entire process in one platform, from collection through prioritization to roadmap communication.

Start today and have your feedback portal up and running in minutes.
