Your users have opinions about your product. The question is whether you're capturing them before they churn or after they've already left a scathing review. A website feedback widget gives your visitors and customers a direct line to share bugs, feature requests, and ideas, right where they're experiencing your product.
But not all feedback tools are created equal. Some clutter your interface. Others collect data you'll never use. The best ones integrate seamlessly into your workflow and turn scattered input into actionable insights.
At Koala Feedback, we've built our platform around this exact challenge: helping SaaS teams collect, organize, and prioritize user feedback without the chaos. We know what makes a feedback widget effective because we've obsessed over these details ourselves.
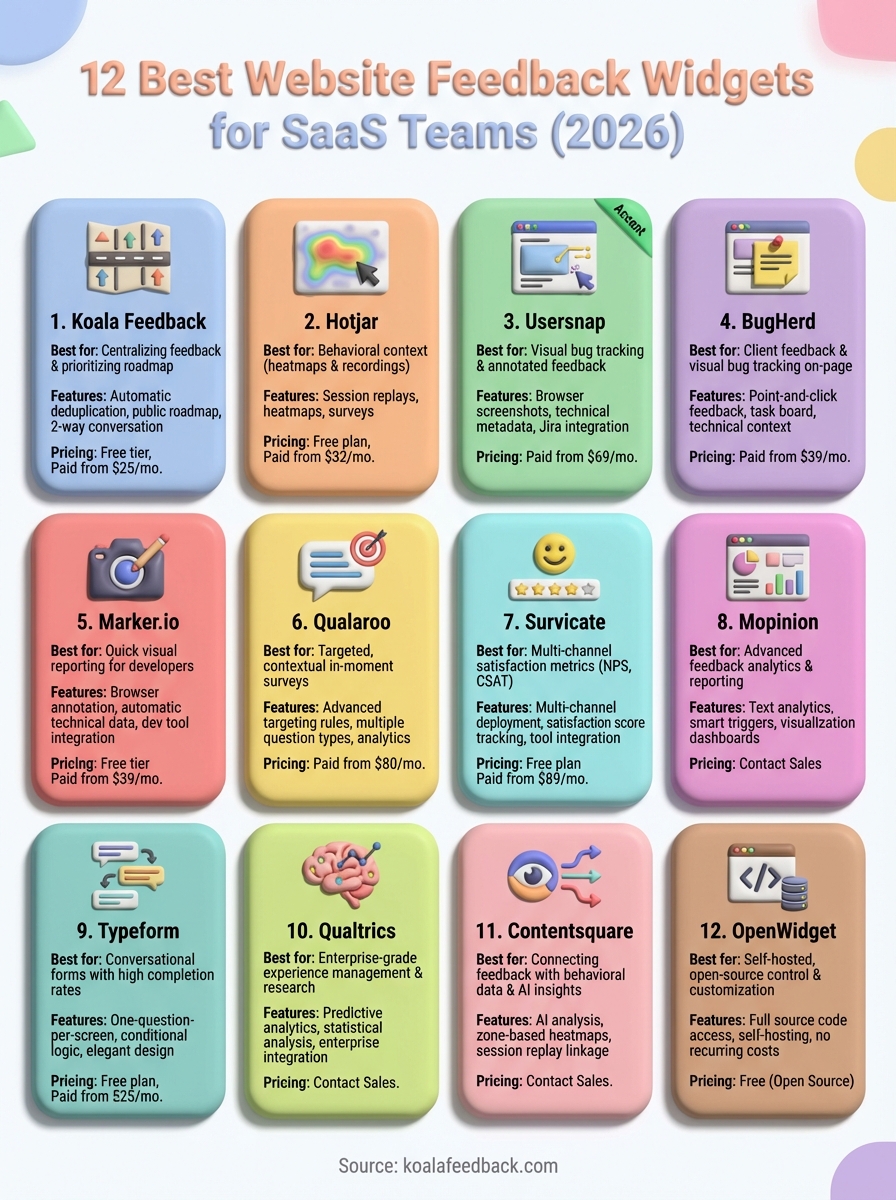
In this guide, we compare 12 website feedback widgets built for SaaS teams in 2026. You'll learn what features matter most, how each tool handles feedback collection, and which option fits your specific needs, whether you're hunting bugs, validating roadmap decisions, or simply giving users a voice.
Koala Feedback starts with a simple premise: collecting feedback shouldn't require your users to leave your product or fill out a 20-question survey. You embed a lightweight widget directly into your website or web app, and users can submit ideas, report bugs, or vote on existing requests without disrupting their workflow.

Koala Feedback operates as a centralized feedback hub where you collect, organize, and prioritize user input through a customizable website feedback widget. Your users click the widget, submit their feedback with optional screenshots, and the system automatically categorizes and deduplicates submissions to prevent your board from turning into a mess of duplicate requests. The platform connects feedback collection to a public roadmap where users can track what you're building, what's planned, and what you've already shipped.
The widget itself lives as a small button on your site that expands into a submission form when clicked. Users can browse existing feedback, upvote ideas they care about, and add comments to ongoing conversations. Everything feeds into your admin dashboard where you sort requests into boards, assign statuses, and decide what makes it onto your product roadmap.
This tool fits SaaS product teams that want to involve users directly in product decisions without drowning in scattered emails and support tickets. You'll get the most value if you're building software where user input shapes your roadmap and you need a transparent way to show customers that you're listening. Teams that struggle with prioritization find Koala Feedback particularly useful because the voting system surfaces what actually matters to your user base.
Koala Feedback works best when you're ready to give users a voice in your product direction and have the capacity to act on what they tell you.
The automatic deduplication saves you from manually sorting through dozens of identical feature requests. When multiple users submit similar ideas, Koala Feedback groups them together and aggregates votes, giving you clean data on what your users actually want.
You can customize everything from the widget's colors to the domain it lives on, making it feel like a natural extension of your brand. The public roadmap feature lets you communicate your product direction openly, which builds trust and reduces the "when will you build this?" questions in your support queue.
Your feedback portal becomes a two-way conversation where users see their ideas move from submitted to planned to completed, closing the loop that most feedback tools ignore.
Koala Feedback offers a free tier that gives you access to core features with a limited number of tracked users. Paid plans start at $25 per month for growing teams and scale based on your user count and feature needs, with options to remove branding and add custom domains as you upgrade.
Hotjar combines feedback collection with behavioral analytics, giving you both what users say and what they actually do on your site. The platform includes a website feedback widget alongside heatmaps, session recordings, and surveys, creating a complete picture of user experience rather than just collecting isolated comments.
The feedback widget appears as a customizable tab on the side of your website where users can submit comments, rate their experience, or answer targeted questions. You configure triggers to show the widget at specific moments in the user journey, like after a purchase attempt or when someone spends a certain amount of time on a page. Submissions flow into your Hotjar dashboard where you can analyze patterns across feedback, recordings, and heatmaps to understand the full context behind user complaints or suggestions.
Your team will benefit most from Hotjar if you need behavioral context around user feedback. Product managers who want to see not just what users report but how they actually interact with features find this combination valuable. Marketing teams use it to understand friction points in conversion funnels, while UX designers leverage the heatmaps to validate or challenge what users claim in their feedback.
Hotjar works best when you need to verify user feedback against actual behavior patterns on your site.
SaaS teams running experimentation programs get the most value because you can correlate feedback with session recordings to see exactly where users struggle. Companies with complex user journeys benefit from understanding both the quantitative data and qualitative input in one platform.
The session replay integration lets you watch recordings of users who submitted feedback, turning vague complaints into concrete issues you can fix. Heatmaps show where users click, scroll, and abandon pages, giving you visual data to support or contradict written feedback.
Hotjar offers a free plan with basic features for small sites. Paid plans start at $32 per month and scale based on daily sessions tracked, with business tiers unlocking advanced targeting and unlimited recordings.
Usersnap focuses on visual feedback collection through annotated screenshots and screen recordings, making it easier for your users to show you exactly what's wrong rather than describing it in words. The platform targets bug tracking and visual feedback specifically, building features around the idea that a marked-up screenshot communicates issues better than a paragraph of text.
The Usersnap website feedback widget lets users capture screenshots or screen recordings directly from their browser, then annotate them with arrows, text, and highlights before submitting. When someone clicks your feedback button, they can draw on their screen to point out specific elements or behaviors that need attention. The tool automatically captures technical metadata like browser version, screen resolution, and console logs alongside each submission, giving your developers the context they need to reproduce and fix issues.
All feedback flows into a centralized dashboard where you can assign tickets, add labels, and push items directly to your project management tools. Your team sees not just what users reported but the exact visual context of where problems occur.
Development teams handling visual bugs and UI issues get the most value from Usersnap because the screenshot annotations eliminate back-and-forth clarification. You'll find it particularly useful if your product has complex interfaces where describing problems in text becomes difficult for non-technical users.
Usersnap works best when you need to debug visual issues and want users to show rather than tell you what's broken.
The automatic technical data capture gives developers everything they need to reproduce bugs without asking users for their browser version or console errors. Integration with tools like Jira, Trello, and Slack means feedback lands directly in your existing workflow rather than creating another inbox to monitor.
Usersnap starts at $69 per month for the Startup plan, with pricing scaling based on team size and features. They offer a free trial to test the platform before committing.
BugHerd transforms your website into a collaborative workspace where clients, stakeholders, and team members can pin feedback directly onto the page like sticky notes. The platform specializes in visual bug tracking and client feedback management, making it a favorite among web development agencies that need a clean way to collect and organize website issues without teaching clients complicated tools.

BugHerd's website feedback widget lets users click anywhere on your site to drop a pin and attach comments, much like leaving notes on a physical design mockup. When someone spots an issue, they click the BugHerd icon, select the problematic element, and type their feedback. The system automatically captures browser information, page URL, and screenshots, organizing everything into a visual task board that mirrors your website's structure.
Your team receives feedback as organized tasks complete with priority levels, assignees, and status updates. The sidebar interface shows all feedback pins on the current page, making it easy to see exactly what needs attention where. Each task includes the technical context developers need without requiring users to manually document their setup.
Web development agencies and client-facing teams get the most value from BugHerd because it simplifies how non-technical stakeholders report issues. You'll find it particularly useful during website launches and redesigns when multiple people need to provide feedback on the same pages without creating communication chaos.
BugHerd works best when you need clients or stakeholders to pinpoint issues directly on the page without learning new tools.
The kanban-style task board organizes feedback by status, making it simple to track what's reported, in progress, or completed. Integration with Jira, Trello, GitHub, and Slack pushes tasks directly into your development workflow.
BugHerd starts at $39 per month for small teams with limited projects. Plans scale to $129 per month for growing agencies, with enterprise options available for larger organizations needing advanced features.
Marker.io strips away the complexity of feedback collection by letting users capture and annotate what they see directly in their browser. The platform built its reputation among development teams by focusing on speed and simplicity, making it effortless for anyone to report bugs or suggest changes without needing technical knowledge or special training.
The Marker.io website feedback widget appears as a floating button that users click to instantly capture their screen and mark up issues with shapes, arrows, and text annotations. When someone spots a problem, they activate the widget, draw directly on the browser window to highlight specific elements, and submit their feedback with automatic technical data attached. The tool captures console logs, network requests, and browser metadata without requiring users to know what any of that means.
Your feedback lands in a centralized dashboard where you can triage, assign, and push issues straight into tools like Jira, GitHub, Trello, or Asana. Each submission includes the visual annotation, technical environment data, and any comments the reporter added, giving your developers everything they need to reproduce and fix problems quickly.
Development teams that need technical context alongside visual feedback get the most value from Marker.io. You'll find it particularly useful if you're managing multiple projects or client sites where bugs need quick documentation and routing to the right developer without layers of communication overhead.
Marker.io works best when your team needs to move fast from bug report to resolution without back-and-forth clarification.
The browser extension makes feedback collection even faster by letting users capture and annotate without leaving their current workflow. Integration with developer tools pushes tickets directly into your existing sprint planning and bug tracking systems, eliminating manual data entry.
Marker.io offers a free tier for small teams testing the platform. Paid plans start at $39 per month and scale based on team size and project needs, with enterprise pricing available for larger organizations.
Qualaroo takes a different approach to feedback collection by using targeted surveys that appear at specific moments in the user journey. Instead of providing an always-on feedback button, the platform shows questions when users take certain actions or meet defined conditions, helping you gather contextual insights about particular features, pages, or experiences rather than general commentary.
The Qualaroo website feedback widget displays as a slide-out survey that appears based on triggers you configure, such as exit intent, time on page, or specific user behaviors. You design questions targeting exact moments when feedback matters most, like asking about checkout experience right after a purchase attempt or querying feature satisfaction immediately after someone uses a new tool. The platform supports multiple question types including multiple choice, rating scales, and open-ended responses, giving you structured data alongside qualitative feedback.
Your responses flow into an analytics dashboard where you can filter by user segment, question type, and response patterns. The tool tracks response rates and completion data, helping you understand which questions work and which ones users skip.
Product teams running conversion optimization programs get the most value from Qualaroo because you can pinpoint exactly where users struggle in specific flows. You'll find it particularly useful when you need quantitative feedback alongside qualitative comments to support product decisions with data.
Qualaroo works best when you need targeted, contextual feedback at specific points in the user journey rather than general-purpose comments.
The advanced targeting rules let you show different surveys to different user segments based on behavior, location, or device type. Integration with analytics platforms connects survey responses to broader user behavior data, creating a complete picture of user sentiment.
Qualaroo starts at $80 per month for basic plans with limited surveys and responses. Pricing scales to $200+ per month for teams needing advanced targeting, unlimited surveys, and higher response volumes.
Survicate operates as a multi-channel feedback platform that extends beyond your website to capture user sentiment across email, in-product experiences, and mobile apps. The platform specializes in customer satisfaction metrics like NPS, CSAT, and CES scores, giving you structured data about user happiness alongside traditional feedback collection.
The Survicate website feedback widget appears as customizable survey forms that you can trigger based on user behavior, page visits, or time-based conditions. You create surveys using their template library or build custom questions from scratch, then deploy them across multiple touchpoints where your users interact with your product. The platform captures responses and automatically calculates satisfaction scores, tracking trends over time to show whether your product improvements actually move the needle on user happiness.
Your feedback lands in a unified dashboard that segments responses by source, user attributes, or custom properties you define. Integration with tools like Slack, HubSpot, and Intercom pushes insights directly into your existing workflow, turning raw responses into actionable team notifications when satisfaction scores drop or specific issues get mentioned repeatedly.
Teams focused on measuring customer satisfaction through standardized metrics get the most value from Survicate. You'll find it particularly useful if you need to track NPS scores over time or want to understand satisfaction across different user segments and product areas.
Survicate works best when you need structured satisfaction metrics alongside qualitative feedback across multiple channels.
The multi-channel deployment lets you maintain consistent survey experiences whether users encounter them on your website, in email campaigns, or inside your product. Analytics tools track response patterns and trends over time, showing which features or changes impact satisfaction scores most significantly.
Survicate offers a free plan with limited surveys and responses. Paid plans start at $89 per month for growing teams, scaling based on survey volume and advanced features like unlimited responses and custom branding.
Mopinion positions itself as an all-in-one feedback analytics platform that combines website feedback collection with advanced analysis and reporting capabilities. The tool captures user input through customizable forms while providing robust analytics to help you understand patterns and trends in what users tell you, making it particularly suited for teams that need to justify decisions with concrete data rather than gut feelings.
The Mopinion website feedback widget appears as customizable forms that you can trigger through buttons, passive collection points, or specific user actions on your site. You design feedback forms with various question types including ratings, multiple choice, and open text fields, then deploy them across your digital properties. The platform automatically categorizes and tags incoming feedback using customizable rules and machine learning, organizing submissions into meaningful segments you can analyze. Your data flows into visualization dashboards that show sentiment trends, keyword frequencies, and response patterns across different user groups or time periods.
Teams that need to present feedback insights to stakeholders and executives get the most value from Mopinion because the platform translates raw comments into charts, graphs, and reports. You'll find it particularly useful if you're running digital optimization programs where you need to track how user sentiment changes after implementing new features or redesigns.
Mopinion works best when you need to transform scattered feedback into structured insights that inform strategic decisions.
The advanced text analytics automatically extract themes and keywords from open-ended responses, showing what topics appear most frequently without manual reading. Smart triggers let you show different feedback forms to users based on behavior patterns like scroll depth, time on page, or specific actions taken.
Mopinion requires you to contact sales for custom pricing based on your feedback volume and feature needs. They don't publish standard pricing tiers publicly, positioning themselves as an enterprise-focused solution.
Typeform approaches feedback collection through elegant, conversational forms that ask one question at a time rather than overwhelming users with long surveys. The platform built its reputation on creating forms that feel more like conversations than interrogations, which can lead to higher completion rates when you need detailed feedback from users who might otherwise abandon traditional survey widgets.
The Typeform website feedback widget embeds into your site as a button or inline form that opens a full-screen experience where users answer questions sequentially. Instead of showing all fields at once, the platform displays one question per screen, guiding respondents through your feedback flow with smooth transitions and progress indicators. You build forms using their visual editor, adding question types from multiple choice to file uploads, then embed them into your product or trigger them through specific user actions.
Your responses collect in a centralized dashboard where you can view individual submissions, export data, or push answers into connected tools like Slack, Google Sheets, or your CRM. The platform tracks completion rates and drop-off points, helping you identify which questions cause users to abandon the feedback process.
Marketing and product teams that prioritize user experience and completion rates get the most value from Typeform. You'll find it particularly useful when you need longer feedback flows where traditional forms might intimidate users or when brand presentation matters as much as the data you collect.
Typeform works best when you need detailed feedback from users and want to maximize completion rates through better design.
The conditional logic feature shows or hides questions based on previous answers, creating personalized feedback paths that keep users engaged. Integration with analytics and automation tools connects feedback directly to your broader workflow without manual data transfer.
Typeform offers a free plan with limited responses and basic features. Paid plans start at $25 per month for individuals, scaling to $83 per month for teams needing advanced logic, custom branding, and unlimited responses.
Qualtrics operates as an enterprise-grade experience management platform that extends far beyond basic feedback collection into comprehensive research and analytics capabilities. The platform serves large organizations that need to capture, analyze, and act on feedback across every customer touchpoint while maintaining scientific rigor in their data collection methods.
The Qualtrics website feedback widget deploys as part of a broader experience management system that connects feedback to customer journey mapping, sentiment analysis, and predictive analytics. You design surveys and feedback forms using their research-backed templates or build custom instruments from scratch, then distribute them through website widgets, email campaigns, mobile apps, or SMS. The platform captures responses and applies statistical analysis automatically, identifying significant patterns and correlations that might influence business outcomes. Your data flows into dashboards that track key metrics, compare performance across segments, and surface insights through natural language summaries that translate complex statistics into actionable recommendations.
Organizations running comprehensive customer experience programs get the most value from Qualtrics because the platform handles everything from initial feedback collection through advanced statistical modeling. You'll find it particularly useful if you need to coordinate feedback initiatives across multiple departments and regions while maintaining consistent measurement standards and reporting structures.
Qualtrics works best when you need enterprise-grade analytics and scientific rigor in how you collect and interpret customer feedback.
The predictive analytics engine uses machine learning to forecast which feedback signals correlate with customer retention, expansion, or churn. Integration with enterprise systems like Salesforce, SAP, and Tableau connects feedback data to broader business intelligence platforms, creating unified reporting across your organization.
Qualtrics requires you to contact their sales team for custom pricing based on your organization's size, feature requirements, and deployment scope. They position themselves as an enterprise solution with pricing that reflects comprehensive capabilities rather than simple feedback collection.
Contentsquare combines feedback collection with deep behavioral analytics and AI-powered insights to show you both what users say and precisely how they interact with every element on your site. The platform targets enterprise organizations that need to connect qualitative feedback to quantitative behavioral data, helping teams understand the complete story behind user frustration or satisfaction rather than relying on isolated comments.
The Contentsquare website feedback widget captures user comments and ratings while simultaneously tracking mouse movements, clicks, scrolling patterns, and navigation paths across your site. When someone submits feedback, the system links their comments to session replays and heatmaps, showing exactly what they experienced before deciding to speak up. You access all data through a unified analytics platform that applies AI analysis to identify friction points, revenue impacts, and conversion blockers that might not surface through feedback alone. The tool automatically segments users based on behavior patterns and correlates their feedback with actual outcomes like purchases, sign-ups, or abandonment.
Organizations managing complex digital experiences across multiple platforms get the most value from Contentsquare because the platform connects feedback to comprehensive user behavior data. You'll find it particularly useful when you need to justify significant UX investments with concrete evidence linking user sentiment to business metrics like conversion rates or revenue impact.
Contentsquare works best when you need to validate feedback against actual user behavior and business outcomes.
The AI-powered analysis automatically identifies friction points and opportunities by analyzing millions of user interactions alongside feedback submissions. Zone-based heatmaps show which specific page elements trigger negative feedback, letting you prioritize fixes based on actual impact rather than volume of complaints.
Contentsquare requires you to contact their sales team for custom pricing based on your traffic volume, feature requirements, and implementation scope. They position themselves as an enterprise solution with pricing reflecting comprehensive analytics capabilities beyond basic feedback collection.
OpenWidget takes an open-source approach to feedback collection, giving you complete control over your feedback infrastructure without vendor lock-in or recurring subscription costs. The platform provides a self-hosted solution that you deploy on your own servers, making it attractive for teams with specific security requirements or those who prefer owning their data entirely rather than relying on third-party services.
The OpenWidget website feedback widget installs as downloadable code that you integrate into your site and host on your own infrastructure. Users click your feedback button to submit comments, bug reports, or feature requests, with all data storing in your database rather than external servers. You customize every aspect of the widget's appearance and functionality by modifying the source code directly, giving you unlimited flexibility to match your exact requirements. The platform supports email notifications and basic categorization of submitted feedback, providing core functionality without the advanced analytics or AI features found in paid enterprise solutions.
Development teams with technical capabilities to deploy and maintain self-hosted solutions get the most value from OpenWidget. You'll find it particularly useful if you work in regulated industries where data must stay on internal servers or if you need complete customization freedom that proprietary platforms can't provide.
OpenWidget works best when you have the technical resources to manage your own infrastructure and prioritize data control over convenience.
The complete source code access lets you modify any aspect of how the widget functions or appears. Zero ongoing costs mean you pay only for hosting and maintenance rather than per-user subscription fees that scale with your growth.
OpenWidget is completely free as an open-source project, with costs limited to your server hosting and any development time needed for customization and maintenance.
Your choice of website feedback widget depends on what you need to accomplish and how your team operates. If you prioritize visual bug tracking, tools like Usersnap or Marker.io excel at capturing screenshots with technical context. Teams focused on customer satisfaction metrics might prefer Survicate or Qualtrics for their structured scoring systems.
Budget plays a role too. Open-source options like OpenWidget eliminate recurring costs, while enterprise platforms like Contentsquare offer comprehensive analytics at premium prices. Consider how the widget integrates with your existing tools and whether you need the feedback to flow into Jira, Slack, or your project management system.
Most importantly, pick a tool that matches your commitment to acting on feedback. The best widget collects input you'll actually use to improve your product. If you want to centralize user requests, prioritize features based on demand, and show customers you're listening, start collecting feedback with Koala Feedback today.

Start today and have your feedback portal up and running in minutes.
