You keep seeing the term thrown around in reports and customer success meetings, but nobody stops to explain it. A customer satisfaction index is a single score that sums up how happy your customers are across several touchpoints, not just one survey question. It gives you a number you can track over time, compare against competitors, and defend in front of leadership.
So what is a customer satisfaction index in practical terms? It's a weighted composite metric, usually built from multiple satisfaction questions, that turns scattered opinions into one comparable figure. Unlike a simple CSAT score after a single interaction, a CSI blends feedback from different stages of the customer relationship into a structured benchmark you can act on.
In this article, you'll get a clear customer satisfaction index definition, walk through the formula and calculation steps, and see what separates a strong score from a mediocre one. We'll also cover how tools like Koala Feedback help you collect the raw feedback that feeds your CSI, so the number reflects what customers actually want, not just what they tolerate.
Managers rarely trust a single survey response when deciding where to spend next quarter's budget. A customer satisfaction index solves that problem by combining dozens or hundreds of data points into one number that holds up in a boardroom. When you can say "our CSI dropped four points after the pricing change," you're speaking a language finance and leadership already understand, and that turns vague complaints into a documented trend worth acting on.
Satisfaction scores move before revenue does, which is exactly why tracking a CSI matters more than watching sign-ups alone. Companies that ignore satisfaction until churn spikes are always reacting a step too late. A falling CSI trend almost always shows up weeks or months before customers actually cancel, giving your team a window to fix the underlying issue.
A dropping CSI is an early warning system, not a lagging report card.
The American Customer Satisfaction Index, a widely cited national benchmark, has shown this pattern across entire industries for decades: satisfaction shifts tend to precede shifts in customer spending and loyalty.
Without an index, you're stuck comparing this month's NPS to last month's, with no sense of how you stack up outside your own bubble. A CSI score built the right way lets you compare against industry averages, competitors, or published benchmarks like the ACSI, so you know whether a "good" score internally is actually good externally.
Here's what a solid CSI practice typically reveals that a single metric can't:
Gathering this reliably means listening constantly, not just during an annual survey. This is where a structured feedback portal earns its keep. Instead of guessing what's driving the number up or down, you can see the actual feature requests, bug reports, and comments customers leave, and connect them directly to satisfaction shifts. That link between raw feedback and a tracked index is what makes a customer satisfaction index meaning something more than a vanity metric on a slide.
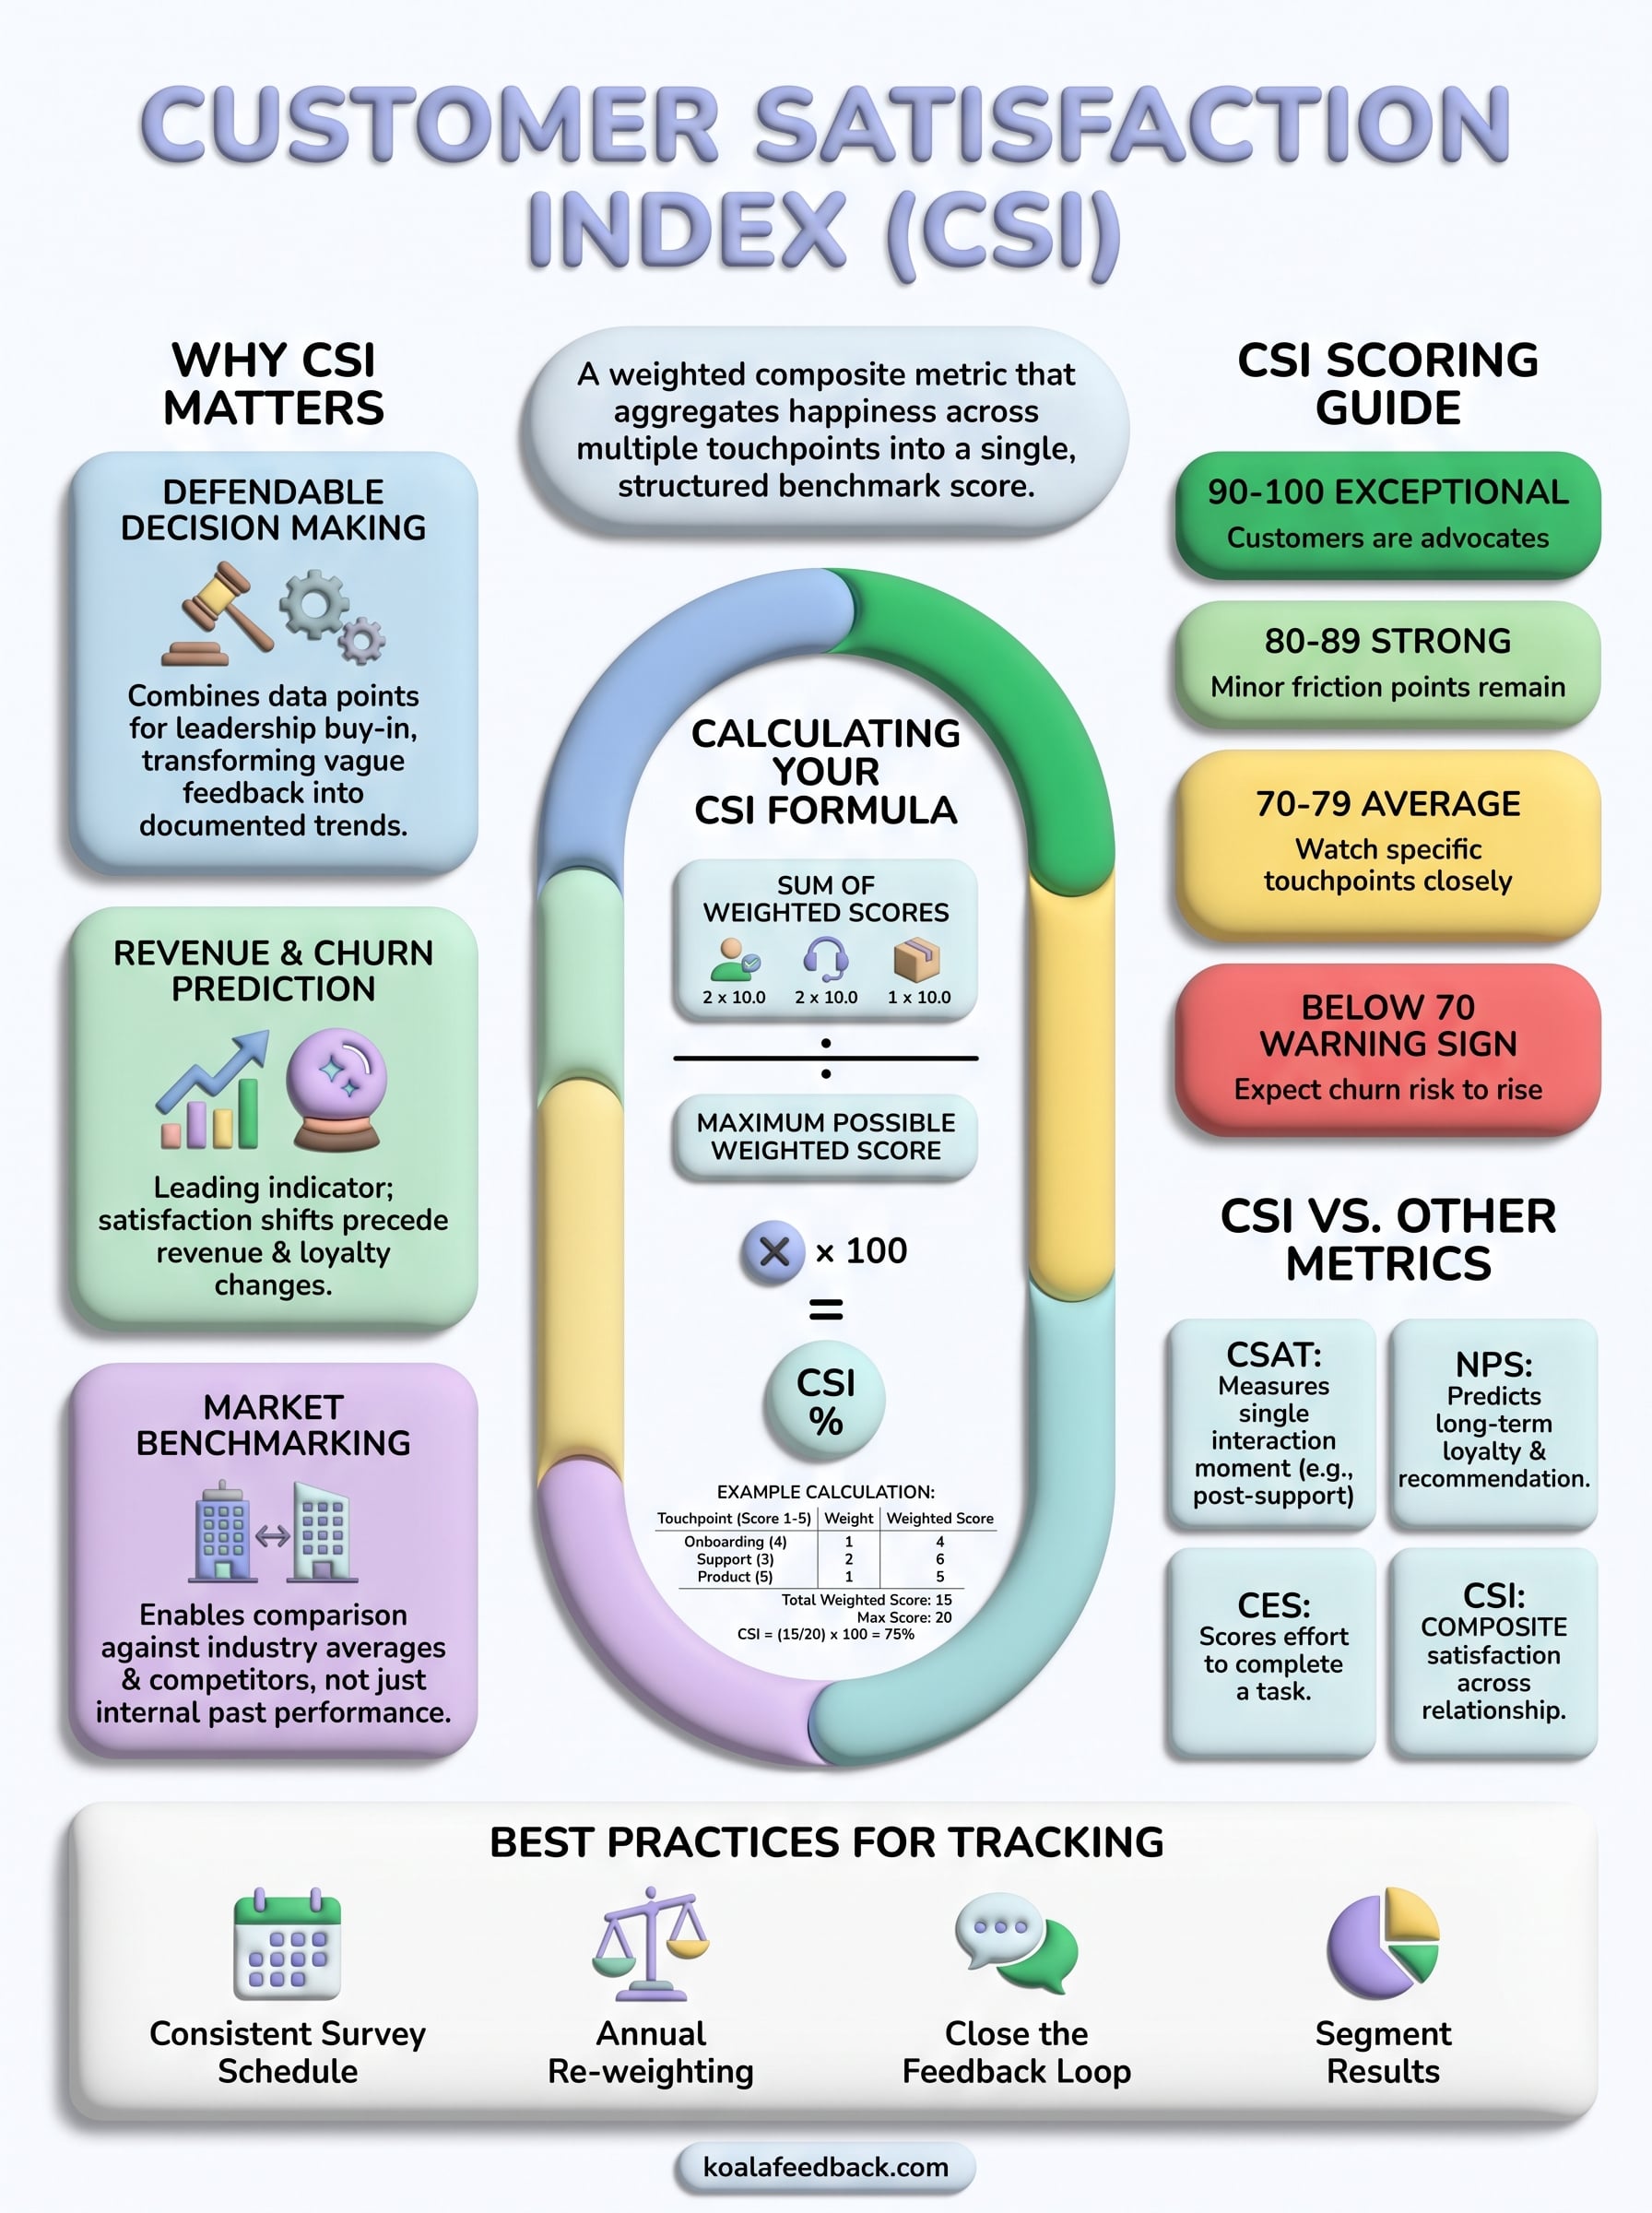
Most teams calculate a CSI using the same core idea: take several satisfaction questions, score each on a fixed scale, then combine them into a weighted average that gets converted into a percentage of the maximum possible score. The formula usually looks like this:
CSI = (Sum of weighted scores / Maximum possible weighted score) x 100
So if you ask customers to rate onboarding, support, and product quality on a 1-to-5 scale, and you weight support twice as heavily because it drives the most churn, you're building a score that reflects what actually matters to your business, not just an average of random questions.
A CSI is only as trustworthy as the weights you assign to each touchpoint.
Here's how the math plays out with real numbers, using three questions and different weights:
| Touchpoint | Score (1-5) | Weight | Weighted Score |
|---|---|---|---|
| Onboarding | 4 | 1 | 4 |
| Support | 3 | 2 | 6 |
| Product quality | 5 | 1 | 5 |
Add the weighted scores (4 + 6 + 5 = 15), divide by the maximum possible weighted score (5 x 4 = 20), then multiply by 100. That gives you a CSI of 75%.
Running this calculation by hand works fine for a pilot survey, but it gets tedious once you're tracking dozens of segments or running the survey monthly. Teams that already collect feedback through a structured feedback portal can pull the raw ratings straight into a spreadsheet or BI tool and automate the weighting, so the index updates itself instead of eating an afternoon every quarter.
Asking "what is a good CSI score" is a bit like asking what a good exam grade is without knowing the subject. A customer satisfaction index in the 80s (out of 100) is strong in most B2B software categories, while airlines and cable providers routinely post scores in the 60s and still call it a good year. The American Customer Satisfaction Index tracks this by sector precisely because a 75 in banking means something different than a 75 in retail.
Before you worry about outscoring competitors, track whether your own number is climbing or sliding. Ranking your score against last quarter tells you more than a national average ever will, especially in your first year of measurement. A rising trend line beats a static high score every time, because it proves your product and support decisions are working.
A good CSI score is the one that's higher than your last one.
While every industry sets its own bar, this range gives you a starting point for interpreting your number:
| CSI Score | What it usually signals |
|---|---|
| 90-100 | Exceptional; customers are advocates |
| 80-89 | Strong; minor friction points remain |
| 70-79 | Average; watch specific touchpoints closely |
| Below 70 | Warning sign; expect churn risk to rise |
Segment your CSI by plan tier, region, or customer age before you panic over a low overall number. Often one struggling segment drags down an otherwise healthy score, and a structured feedback portal helps you spot that segment fast instead of guessing which customers are unhappy.
Confusing these four metrics is one of the fastest ways to misread your own data. Each one answers a different question, and mixing them up leads teams to compare numbers that were never meant to sit side by side. A customer satisfaction index aggregates multiple touchpoints into one score, while CSAT, NPS, and CES each isolate a single moment or feeling. Knowing which tool answers which question keeps your reporting honest.
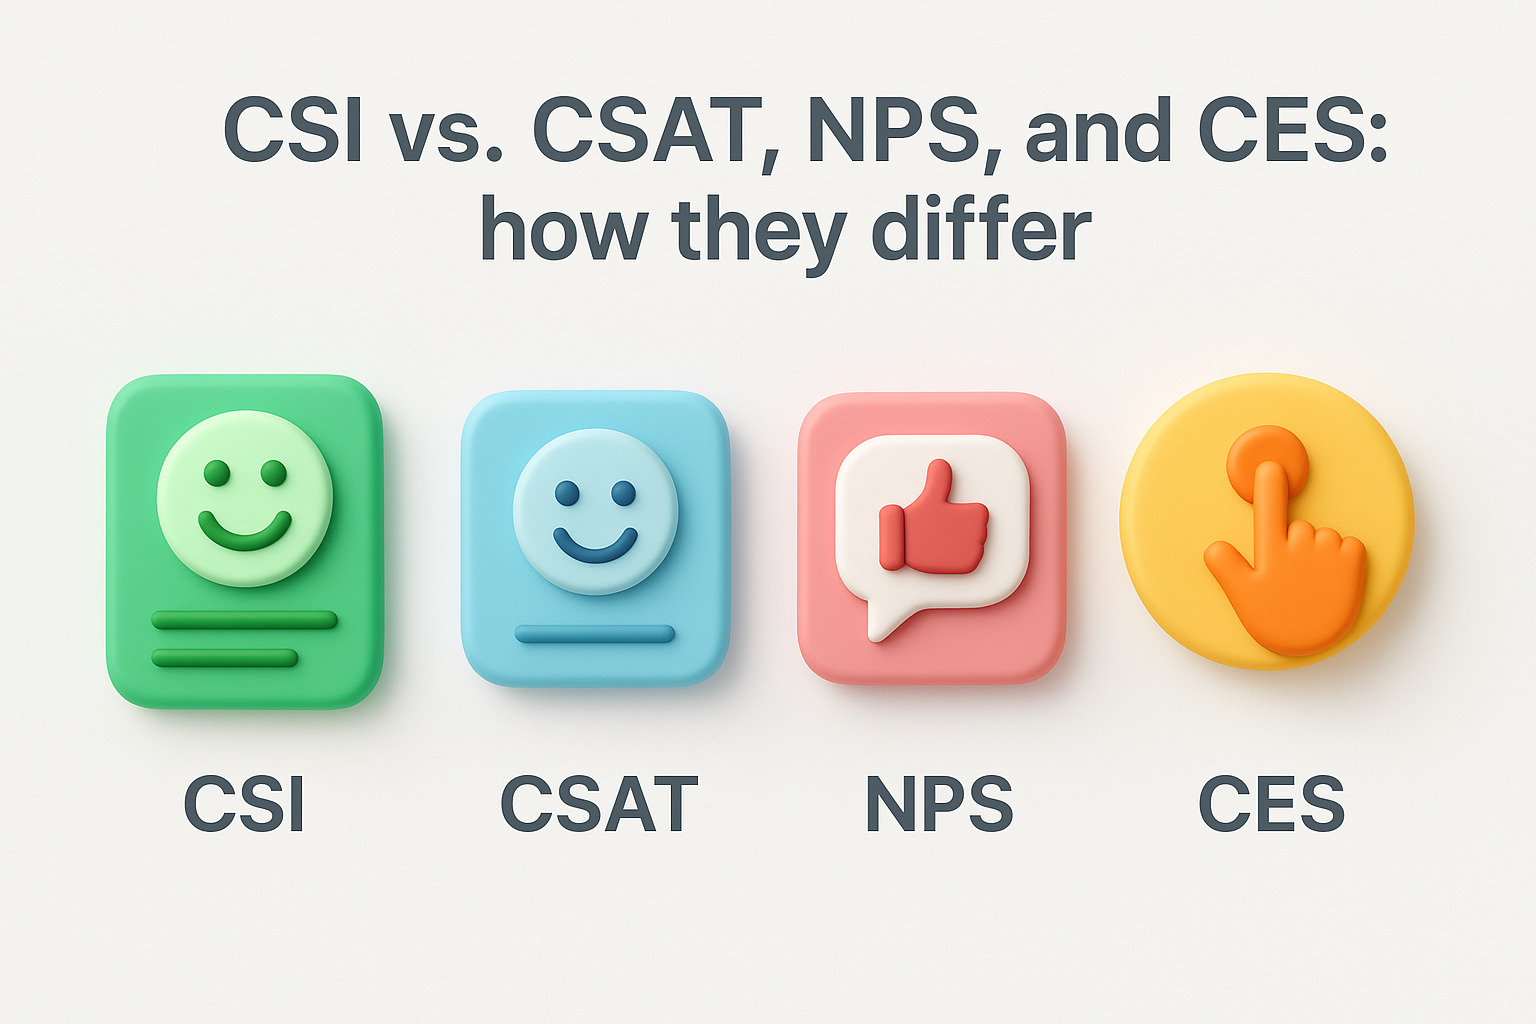
Customer Satisfaction Score (CSAT) asks how happy someone was with one specific interaction, like a support ticket or a checkout flow. It's fast to collect and easy to act on, but it tells you nothing about the customer's overall relationship with your product. A CSI score rolls several CSAT-style questions together across touchpoints, so you see the full picture instead of one snapshot.
Net Promoter Score asks whether someone would recommend you to a friend, which makes it a strong loyalty signal but a weak diagnostic tool. It won't tell you why a customer gave a low score. CSI fills that gap by breaking satisfaction into components you can actually fix, like onboarding or billing.
NPS tells you if customers will stay; CSI tells you why they might leave.
Customer Effort Score measures how hard someone had to work to get something done, useful for spotting friction in support or self-service flows. It's narrow by design.
| Metric | What it measures | Best used for |
|---|---|---|
| CSAT | Single interaction satisfaction | Post-support, post-purchase checks |
| NPS | Likelihood to recommend | Long-term loyalty tracking |
| CES | Effort required to complete a task | Support and onboarding friction |
| CSI | Composite satisfaction across touchpoints | Overall product health, benchmarking |
Building the formula is the easy part. Turning that number into steady improvement takes discipline in how you collect, weight, and act on the feedback behind it. Most teams that see their customer satisfaction index climb year over year follow a handful of habits that have nothing to do with fancy math and everything to do with consistency.
Consistency matters more than frequency. Quarterly surveys sent on the same dates every year let you compare apples to apples, while ad-hoc surveys sent whenever someone remembers introduce seasonal noise you can't control for. Pick a cadence, put it on the calendar, and stick to it even when the number looks bad.
Teams often set weights once and never touch them again, even as the business changes. If support used to drive churn but onboarding does now, your weighting should shift too. Review which touchpoints actually correlate with retention each year and adjust the formula accordingly.
A CSI formula that never changes is measuring last year's business, not this one.
Collecting scores without acting on the comments behind them wastes the entire exercise. A structured feedback portal lets customers explain the low score, not just rate it, and lets you show them you listened by updating a public roadmap. That visibility alone tends to lift satisfaction before the fix even ships.
A customer satisfaction index only earns its keep once it changes what your team does next. You now know the formula, what a healthy score looks like, and how CSI differs from CSAT, NPS, and CES. The number itself is just a snapshot; the real value comes from tracking it consistently and pairing it with the comments and requests customers leave behind. Skip that pairing and you're left with a score you can't explain to leadership or act on with confidence.
Getting there starts with better raw feedback, not a fancier spreadsheet. When customers can submit ideas, vote on what matters, and watch your roadmap move in response, satisfaction climbs on its own. If you're ready to collect that kind of structured, actionable input instead of guessing at what's behind your next CSI dip, try Koala Feedback and see what your customers have been trying to tell you.

Start today and have your feedback portal up and running in minutes.