Google Forms is free, familiar, and already connected to your Google account, which makes it one of the most popular tools for collecting user feedback. But setting up a Google Forms feedback survey that actually gives you useful, actionable data? That takes more than dragging a few question blocks onto a page. The difference between a survey people complete and one they abandon often comes down to structure, question design, and distribution.
Most feedback surveys fail quietly. They collect responses, sure, but the answers are vague, the completion rates are low, and the data sits in a spreadsheet that nobody looks at twice. The problem usually isn't the tool, it's how the survey was built. Question order, response types, and survey length all have a direct impact on the quality of what you get back.
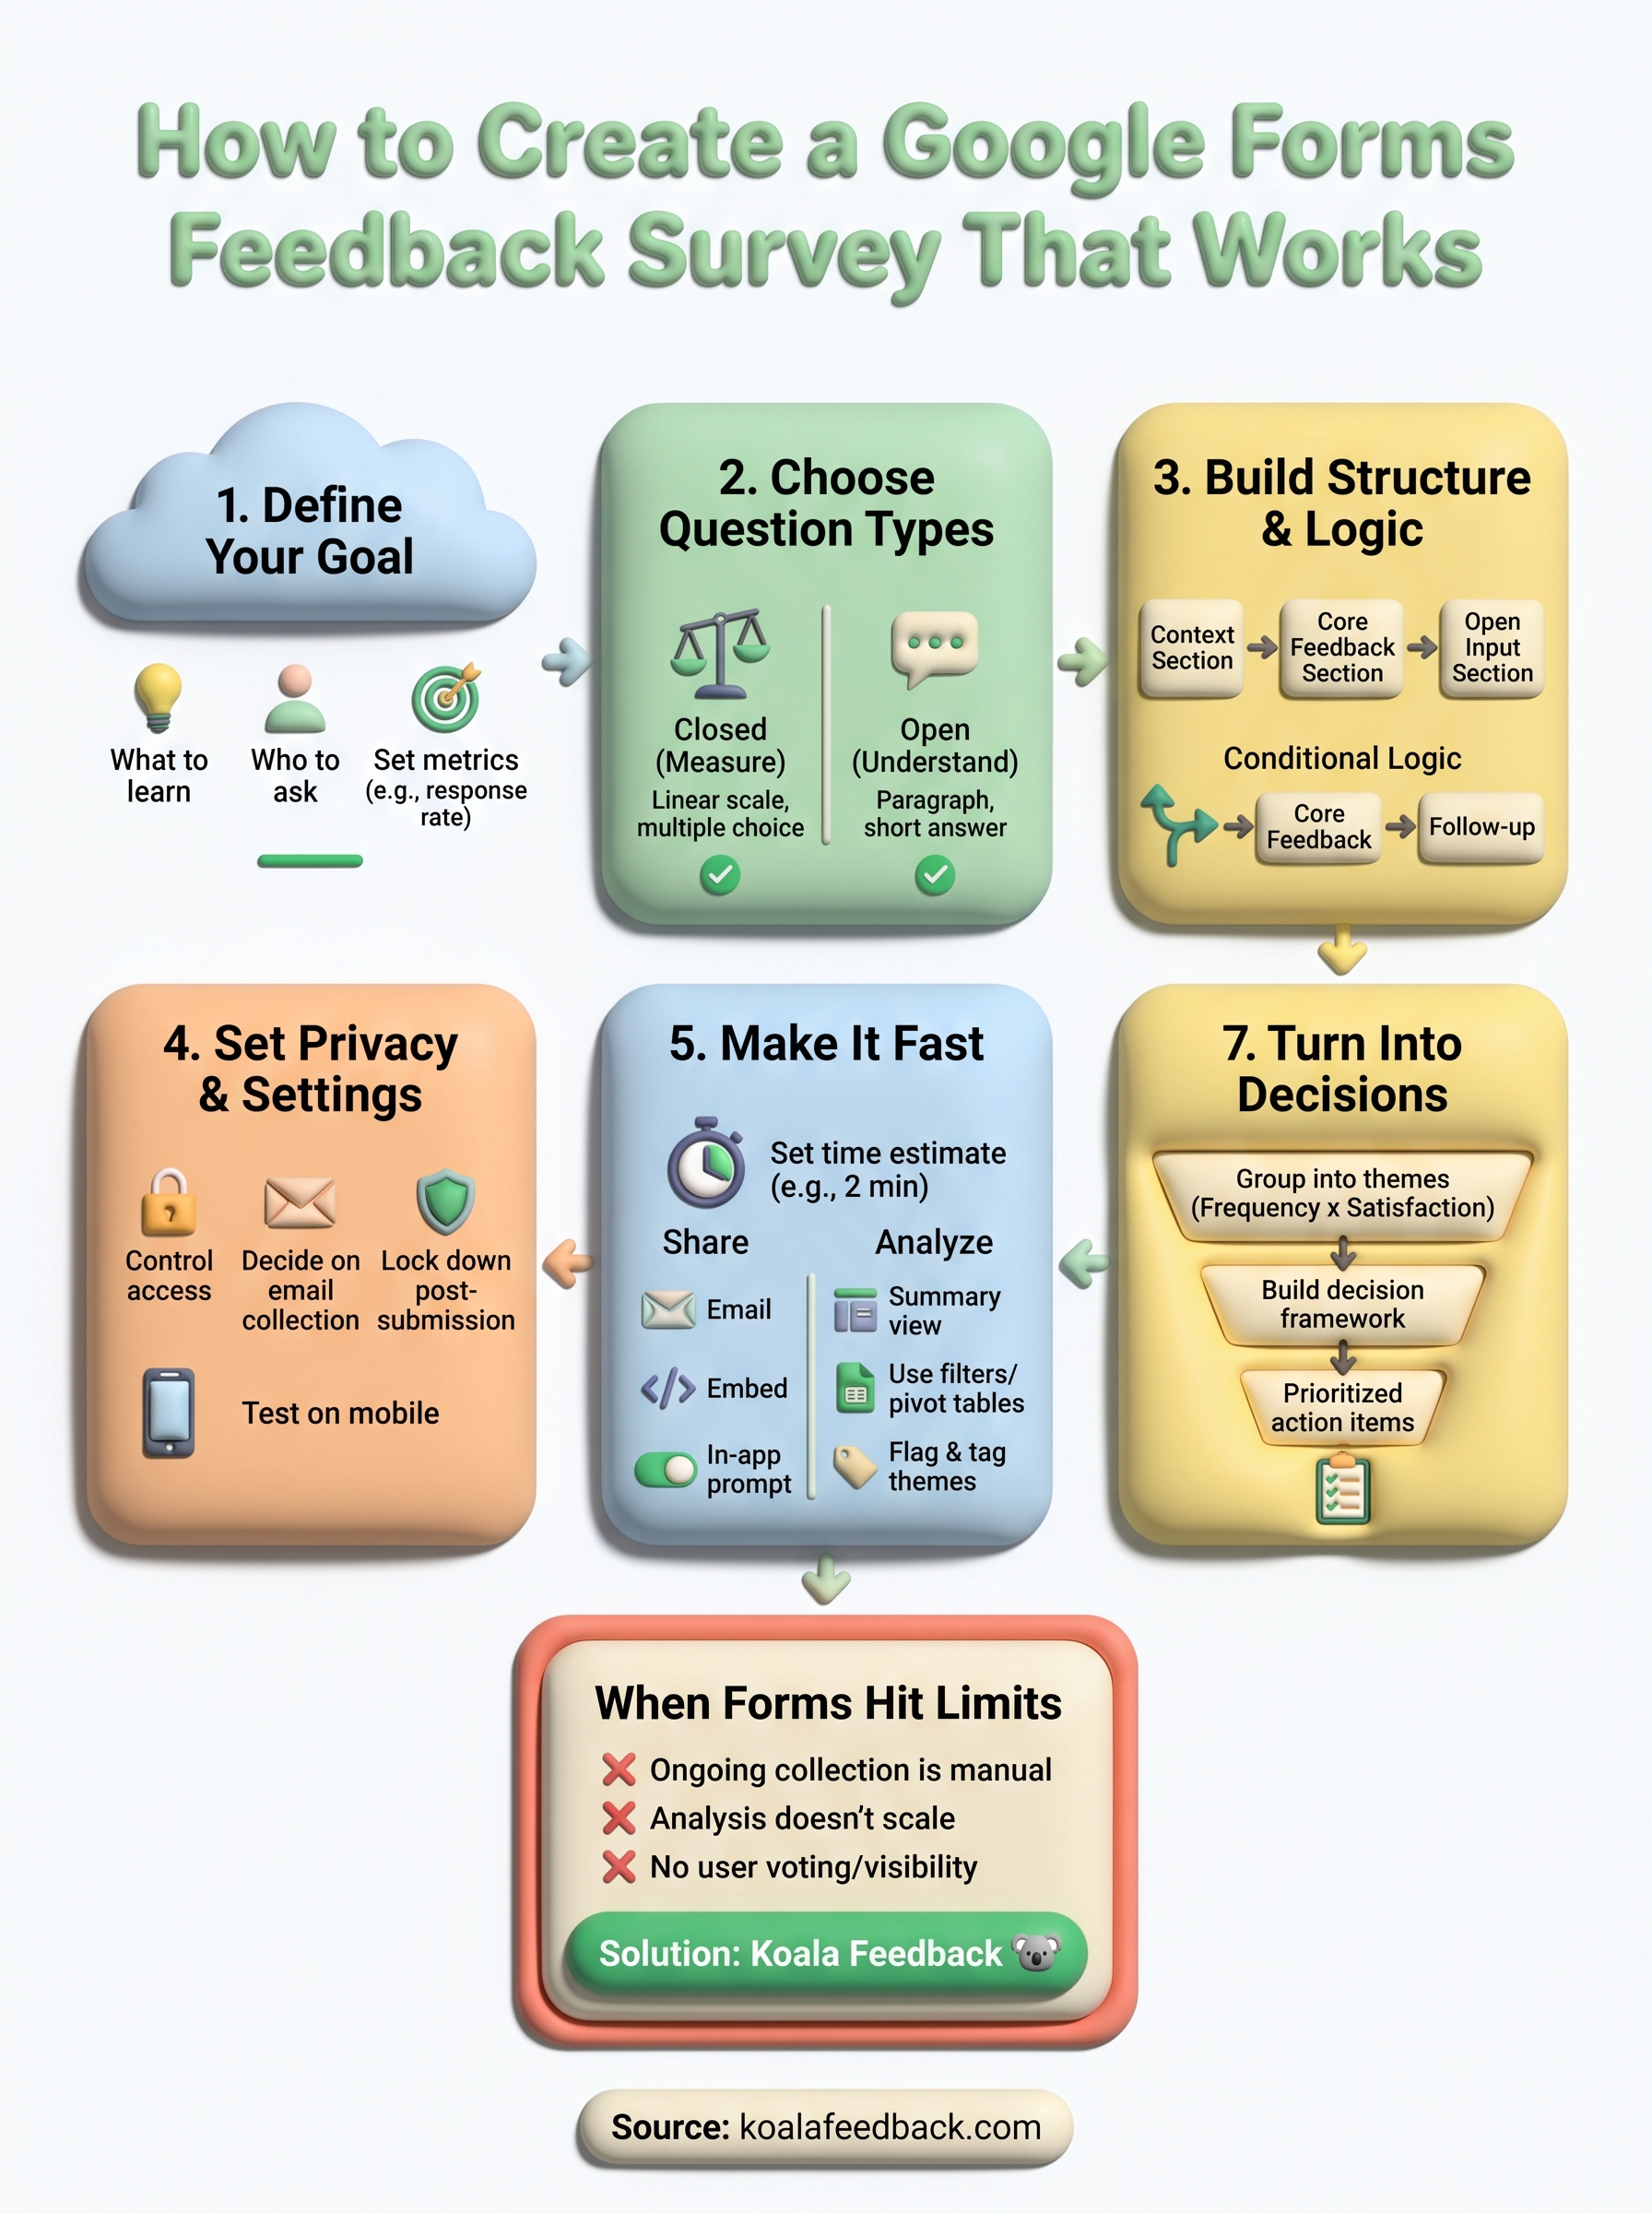
This guide walks you through creating a Google Forms feedback survey from scratch, covering setup, question design, distribution, and analysis. We'll also look at where Google Forms hits its limits, especially if you're a product team trying to collect ongoing user feedback at scale. That's exactly the gap we built Koala Feedback to fill: a purpose-built platform for capturing, organizing, and prioritizing product feedback without stitching together spreadsheets and form links.
Before you start building, it helps to understand what the tool is actually capable of. A Google Forms feedback survey gives you a free, hosted form you can share with anyone, requires no account from respondents, and feeds every answer directly into a spreadsheet. The core value is simplicity: you can go from nothing to a live survey in under 10 minutes, which is why so many product teams reach for it first.
Google Forms supports multiple question formats, giving you real flexibility in how you structure feedback. You can mix open-ended text fields with multiple-choice questions, Likert scale grids, dropdown menus, checkboxes, and date or time inputs. This means you can capture both quantitative ratings (how satisfied are you on a scale of 1 to 5?) and qualitative context (what would you change about this feature?) in the same form.

Here's a quick look at the available question types and when to use them:
| Question Type | Best For |
|---|---|
| Short answer | Names, one-line inputs |
| Paragraph | Open-ended qualitative feedback |
| Multiple choice | Single selection from a list |
| Checkboxes | Multiple selections allowed |
| Linear scale | Satisfaction or effort ratings |
| Multiple choice grid | Rating across several attributes |
| Dropdown | Long lists of options |
Using a mix of closed and open question types gives you data you can measure and context you can actually act on.
One of the more useful features in Google Forms is section branching, which lets you send respondents to different parts of the form based on their answers. If someone selects "I had a problem" in a multiple-choice question, you can route them to a follow-up section that digs into what went wrong. You set branching rules in the three-dot menu on each multiple-choice or dropdown question, then assign a destination section for each answer option.
This keeps the survey relevant to each respondent and cuts down on the friction of answering questions that clearly do not apply to them. A customer who rated their experience a 5 does not need to see your "what went wrong" questions, and conditional logic lets you enforce that without building separate forms.
Every response your form collects flows directly into a linked Google Sheet, with no manual export required. Each column maps to a question, each row is a submission, and Google Sheets timestamps every entry automatically. From there, you can filter, sort, and analyze your data using formulas, pivot tables, or Google's built-in chart tools without switching platforms.
You can also connect that sheet to Looker Studio if you want a visual dashboard from your survey responses. The connection is native and updates in real time as new submissions come in, which makes it easier to spot trends during an active feedback campaign.
Google Forms lets you set up email notifications so your team gets an alert every time someone submits a response. You'll find this option under Responses, then the three-dot menu, then "Get email notifications for new responses." This works well when you're running a short-burst survey and want to review feedback as it lands, rather than checking the spreadsheet manually every few hours.
For ongoing feedback collection, you can also share view-only access to the linked Google Sheet with stakeholders who want to monitor responses without touching the form settings.
Before you open Google Forms and start adding questions, you need to lock down three things: what you want to learn, who you're asking, and how you'll know the survey worked. Skipping this step is the most common reason feedback surveys produce data that looks useful but doesn't actually drive any decisions.
Your survey goal should fit in a single sentence. If it takes a paragraph to describe what you're trying to find out, your scope is too wide and your form will end up bloated with unfocused questions. A tight goal like "understand why users stopped using the reporting feature after the last update" keeps every question purposeful. Write that goal somewhere visible before you build anything, and cut any question that doesn't connect directly to it.
A single, focused goal produces better survey data than a broad goal that tries to capture everything at once.
The audience you target shapes every design decision in your Google Forms feedback survey. A survey sent to new users should look very different from one sent to your most active power users. New users don't have enough experience to rate advanced features, and power users may not remember their onboarding friction. Define your audience segment clearly: how long they've been using your product, what plan they're on, what actions they've taken, or what problem they recently reported.
Once you know who you're asking, you can also decide how many responses you realistically need. A small B2B product with 200 customers needs a different response target than a consumer app with 50,000 monthly active users.
Deciding what a "successful" survey looks like before you send it prevents you from moving the goalposts after the data comes in. Set concrete targets for at least two metrics: a minimum response rate and a minimum number of open-text responses. Without these targets, it's easy to rationalize thin data as good enough.
Here are three metrics worth tracking from the start:
The question types you pick in your Google Forms feedback survey determine the quality of what you get back. Choosing the wrong format for a given goal pushes respondents into answers that don't quite fit, and that mismatch shows up in your data as vague responses or skipped questions. Before you add a single question, decide what kind of information each one needs to return.
Closed questions (multiple choice, linear scale, checkboxes) give you data you can count and compare across respondents. Open questions (short answer, paragraph) give you the context and reasoning behind the numbers. A strong feedback survey uses both formats together. Start with a closed rating question to get a measurable signal, then follow it immediately with an open-text question asking why the respondent gave that rating.
Pairing a rating question with a "why" follow-up is one of the most reliable ways to collect feedback that leads to real product decisions.
Here's a quick reference for matching question type to your feedback goal:
| Feedback Goal | Question Type to Use |
|---|---|
| Measure overall satisfaction | Linear scale (1-5 or 1-10) |
| Identify specific pain points | Checkboxes (select all that apply) |
| Understand reasoning behind a rating | Paragraph (open text) |
| Capture feature preferences | Multiple choice |
| Gather user demographic context | Dropdown |
Grid questions (multiple choice grid or checkbox grid) let respondents rate several items at once, but they carry a real risk: people often fall into straight-line answering, picking the same column across every row without reading carefully. Use grids only when you genuinely need to compare ratings across closely related attributes, like scoring three features on the same satisfaction scale. In most other cases, individual rating questions produce more reliable data.
Phrasing matters just as much as format. A question like "How much did you enjoy our onboarding?" steers respondents toward a positive answer before they even start thinking. Reframe it to "How easy was it to complete your first setup?" to pull in an honest response. Beyond leading language, watch for double-barreled questions: "Was the feature fast and easy to use?" is actually two questions. Split it into two separate items, and you'll end up with cleaner, more actionable data from every response you receive.
Once you know your goal and question types, you need to arrange everything into a form that flows logically for the respondent. A disorganized form where questions jump between unrelated topics causes confusion and drives up drop-off rates. The structure of your Google Forms feedback survey should mirror how a real conversation about your product would unfold: start broad, then narrow in on specifics.
Google Forms lets you split a survey into multiple sections, which you add through the toolbar on the right side of the form editor (the icon that looks like two stacked rectangles). Each section acts as its own page for the respondent, and you control the button label at the bottom of each one. Group questions by theme: context questions first, core feedback questions in the middle, and any open-ended or optional questions at the end.
Here is a simple three-section structure that works for most product feedback surveys:
| Section | Purpose | Example Questions |
|---|---|---|
| Section 1: Context | Understand who the respondent is | Role, how long they've used the product |
| Section 2: Core feedback | Collect rated and specific feedback | Satisfaction scale, feature ratings |
| Section 3: Open input | Capture qualitative detail | What would you improve? Anything else? |
Putting open-ended questions at the end keeps the entry point of the survey low-friction, which helps more respondents get started.
Section branching lets you route respondents to different parts of the form based on what they select. To configure it, click the three-dot menu at the bottom of a multiple-choice or dropdown question, then choose "Go to section based on answer." You can then assign a destination section to each individual answer option.

For example, if you ask "Did you complete the task you set out to do?" with Yes/No options, you can send "No" respondents to a section that asks what blocked them, while "Yes" respondents skip straight to a satisfaction rating. This keeps the survey relevant to each person's experience and prevents respondents from answering questions that clearly do not apply to them. Always test your branching paths before sending by using Google Forms' preview mode, which you access through the eye icon at the top of the editor. Click through every possible answer combination to confirm each path lands in the right place.
Privacy settings in your Google Forms feedback survey directly affect whether respondents trust the form enough to answer honestly. Before you share the link, spend a few minutes in the Settings tab to make deliberate choices about who can respond, what data you collect, and what happens after someone submits. These decisions are easy to overlook, but they shape both your response quality and your legal exposure.
Google Forms gives you two main access levels for respondents. Under Settings, then Responses, you can either allow anyone with the link to respond, or restrict responses to people within your Google Workspace organization. If you're running an internal product feedback session with your team, the organization-restricted option keeps outside submissions out. For external user feedback, you'll leave it open to anyone.
You can also check "Limit to 1 response" in the same section, which prevents the same Google account from submitting more than once. This is useful for structured surveys where duplicate responses would skew your data, but it requires respondents to sign in, which adds friction and may lower your response rate.
If you restrict responses to signed-in users, make sure that trade-off is worth it for your specific audience before enabling it.
The "Collect email addresses" setting appears at the top of the Responses section in Settings. Turning it on automatically logs the respondent's email with every submission. This lets you follow up with specific users, but it also removes anonymity, which can make people less willing to share candid feedback about your product.

Here is a quick breakdown to help you decide:
| Setting | Use When | Trade-off |
|---|---|---|
| Collect email addresses | You need to follow up individually | Reduces candor |
| Do not collect emails | You want honest, unfiltered feedback | No direct follow-up possible |
| Responder receives a copy | You want respondents to keep a record | Adds a confirmation step |
Under the Presentation tab in Settings, you control two post-submission behaviors. First, you can uncheck "Allow response editing" to prevent respondents from changing their answers after they submit. Second, you can turn off "See summary charts and text responses", which stops respondents from viewing aggregated results after completing the form. For product feedback where you want raw, uninfluenced data, disabling both of these is the safer choice.
A Google Forms feedback survey that takes too long loses respondents before it delivers useful data. The drop-off rate on surveys increases sharply after the three-minute mark, which means every question you add beyond what you genuinely need is actively costing you responses. Before you send anything, run through the completed form yourself and time it. If it takes more than three minutes to finish, start cutting.
The description field at the top of your form is valuable real estate. Use it to tell respondents exactly how long the survey takes: "This takes about 2 minutes" removes uncertainty and commits you to keeping the form tight. People are more likely to start a survey when they know the end is close, and setting that expectation up front is one of the simplest ways to improve your completion rate.
Your description field can also carry a brief reason why the feedback matters. A single sentence like "Your answers help us decide what to build next" is enough to connect the respondent's effort to a real outcome and make the ask feel worthwhile.
Google Forms lets you toggle any question between required and optional using the toggle at the bottom right of each question card. Only mark a question as required if a missing answer would make the response useless. Over-requiring questions frustrates respondents and causes form abandonment when someone genuinely does not have an answer.
Reserve the required toggle for your core rating questions and any questions that drive your conditional logic, and make everything else optional.
Keep open-text questions optional whenever possible. Forcing a written response when someone has nothing specific to say produces low-quality filler answers that add noise to your data rather than signal.
A large share of survey respondents will open your form on a phone. Google Forms renders reasonably well on mobile, but grid questions often break on small screens because they run too wide for the viewport. Open your form in preview mode, then switch to a mobile device or resize your browser window to a narrow width. Check that every question is readable and tappable without horizontal scrolling. If a grid question is hard to interact with on mobile, replace it with individual rating questions that stack cleanly on a small screen.
Getting your Google Forms feedback survey in front of the right people at the right moment is just as important as how you built it. The distribution channel you choose directly affects your response rate, so match the channel to where your users are most active and most likely to engage with a short task.
Google Forms gives you a shareable link, an embed code, and a direct email option through the Send button at the top of the form editor. For most product teams, a direct email to a targeted user segment produces the highest response rates because it reaches someone in a context where they can act immediately. Embed the form on a thank-you page or in your app if you want to catch users right after a key action, like completing their first setup or submitting a support ticket.
Here is a quick channel comparison to help you decide:
| Channel | Best For | Expected Response Rate |
|---|---|---|
| Direct email | Existing user base, targeted segments | 10-20% |
| In-app prompt | Catching users post-action | 5-15% |
| Embedded on page | Post-checkout or post-onboarding | 3-10% |
| Social media link | Broad, unfiltered audience | Under 3% |
Your email subject line and opening sentence do most of the work. Keep the subject line under 50 characters and make it specific: "Quick question about [Feature Name]" outperforms vague lines like "We want your feedback." In the body, lead with why the person's input matters and set a clear time expectation in the first two lines.
Telling respondents exactly what you'll do with their answers increases trust and improves completion rates more than any design tweak.
Here is a short email template you can adapt:
Subject: 2 minutes: your take on [Feature]
Hi [First Name],
We're improving [specific feature] and want to hear from you directly. This takes 2 minutes.
[Survey link]
Your answers go straight to the product team and shape what we build next.
Thanks, [Your name]
Tuesday through Thursday mornings consistently produce higher open and click rates for product-related emails than Monday or Friday sends. Send between 9 and 11 a.m. in the recipient's time zone when possible, and avoid sending during major holidays or end-of-quarter periods when inboxes fill up with competing messages.
Once your google forms feedback survey starts collecting submissions, resist the urge to jump straight into the raw spreadsheet. Google Forms gives you two distinct places to review data: the built-in summary view inside the form editor and the linked Google Sheet. Each one serves a different purpose, and using both together gives you a faster path from raw responses to clear patterns.
The Responses tab at the top of your form editor opens the summary view, which automatically generates charts and aggregated counts for every closed question. Bar charts show distribution across multiple-choice answers, pie charts break down single-select responses, and linear scale questions display average ratings alongside full response distributions. This view lets you spot the headline findings in under a minute without touching a spreadsheet formula.

Open-text responses appear as a scrollable list below each paragraph question. Read through the first 20 to 30 qualitative answers in this view before you move to Sheets, because patterns in the wording of open answers often surface faster when you read them in sequence rather than row by row in a spreadsheet.
The summary view tells you what most people said; the Sheets view tells you which specific people said it and why.
Click the green Sheets icon in the Responses tab to open your linked spreadsheet. Every submission appears as a row, with question text as column headers and a timestamp in the first column. From here, you can apply filters, sort by any column, and build pivot tables to cross-reference responses by segment.
Use these four Sheets moves to get actionable signal quickly:
Add a blank column next to each open-text answer column and use it to apply short labels like "usability," "pricing," or "bug report" as you read through responses. This manual tagging takes 20 to 30 minutes on most surveys but makes it significantly faster to count themes and present findings to your team. Sort the tag column once you finish to group similar responses and see at a glance which topics came up most.
Collecting data from your google forms feedback survey only creates value when it leads somewhere concrete. The goal of this step is to move from a tagged spreadsheet full of responses to a short list of decisions your team can act on in the next sprint or planning cycle. That transition requires a deliberate process, not a long meeting where everyone reads raw quotes aloud.
Start by pulling your tagged qualitative responses into a simple tally. Count how many times each tag appears across your open-text answers, then rank the themes by frequency. Combine that frequency data with the average satisfaction scores from your closed questions to get a two-dimensional view: themes that show up often and correlate with low satisfaction scores deserve the most attention.
The combination of frequency and low satisfaction is your clearest signal that a theme represents a real problem worth solving.
Here is a template you can paste into a blank Google Sheet to structure this quickly:
| Theme | Times Mentioned | Avg. Satisfaction Score (1-5) | Priority |
|---|---|---|---|
| Onboarding confusion | 34 | 2.8 | High |
| Missing export feature | 21 | 3.1 | Medium |
| Slow load times | 18 | 2.4 | High |
| UI color contrast | 9 | 3.6 | Low |
Fill in the theme column with your tags, pull the counts from your COUNTIF formula in Sheets, and calculate average satisfaction scores using AVERAGEIF against the corresponding rating column.
Once your themes are ranked, apply a two-question filter to each one before it becomes a formal decision. First, ask whether fixing or building for this theme moves a metric your team already cares about, like activation rate or retention. Second, ask whether enough respondents mentioned it independently to rule out one vocal user skewing the results.
Themes that pass both questions move into your next planning session as prioritized action items with supporting evidence. Themes that fail one question go into a backlog with the raw response data attached, so you can revisit them when priorities shift. Write a one-paragraph summary for each prioritized item that states the theme, the number of respondents who raised it, the average rating from related questions, and a specific recommendation. That format keeps decisions grounded in the actual responses rather than the loudest voice in the room.
A google forms feedback survey works well for a focused, time-bounded data collection effort. You define a goal, send the form, collect responses, and analyze the results. That single-loop model covers a lot of ground, but it breaks down quickly when your feedback needs become continuous rather than episodic. Knowing where the tool stops performing saves you from building workarounds that create more maintenance work than they solve.
Google Forms has no native way to keep a persistent feedback channel open for your users. Every campaign requires a new form, a new distribution effort, and a new spreadsheet. If you want to track how user sentiment shifts across product releases, you're manually comparing separate sheets instead of watching trends in a single view. Stitching together multiple form exports to find patterns across time is tedious work that rarely happens as consistently as it should.
If your team needs feedback on a weekly or monthly cadence, a one-form-at-a-time tool will quietly create a backlog of unreviewed data.
Google Forms gives you raw data. It does not help you identify which requests came up most often, group similar feedback automatically, or rank ideas by user demand. You build all of that logic manually in Sheets, using filters, COUNTIF formulas, and pivot tables. That process works for a few hundred responses, but it does not scale when your user base grows and feedback volume increases. The analysis layer that turns responses into decisions stays a manual job with no shortcut inside the tool.
Every respondent submits into a blank form with no visibility into what others have already said. There is no voting mechanism, no public thread, and no way for users to rally around a shared request. This matters because the most valuable signal in product feedback often comes not from a single response but from multiple users independently describing the same frustration. When you need users to engage with a feedback channel rather than just submit to it, Google Forms offers no path forward.
This is where a purpose-built tool like Koala Feedback fills the gap. It gives your users a place to submit ideas, vote on existing requests, and track what you plan to build, so feedback turns into a conversation instead of a spreadsheet exercise.
A well-built google forms feedback survey gives you a structured, low-cost way to collect focused feedback from your users at any stage of product development. The steps in this guide cover everything from defining your goal and picking question types to distributing the form, analyzing responses in Sheets, and turning themes into prioritized decisions. Follow them in order, and you end up with data you can actually use.
Once you outgrow the one-survey-at-a-time model, you need a tool that keeps feedback flowing continuously without the manual overhead. Koala Feedback gives your users a persistent place to submit ideas, vote on requests, and watch your roadmap update in real time, so nothing gets lost between campaigns. If you're ready to move beyond spreadsheets and build a feedback loop that scales with your product, start collecting smarter feedback with Koala Feedback.

Start today and have your feedback portal up and running in minutes.
